|
Download Data (XLS File) |
|
||||||||
|
||||||||
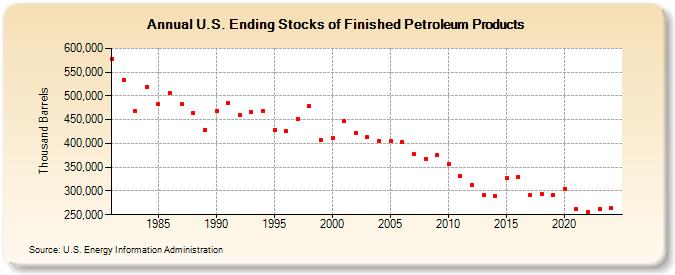
| U.S. Ending Stocks of Finished Petroleum Products (Thousand Barrels) | ||||||||
| Decade | Year-0 | Year-1 | Year-2 | Year-3 | Year-4 | Year-5 | Year-6 | Year-7 | Year-8 | Year-9 |
|---|---|---|---|---|---|---|---|---|---|---|
| 1980's | 577,894 | 534,285 | 468,615 | 519,706 | 483,065 | 506,707 | 482,449 | 464,263 | 428,046 | |
| 1990's | 468,906 | 484,392 | 460,343 | 467,112 | 468,044 | 428,437 | 425,927 | 451,627 | 479,185 | 407,139 |
| 2000's | 411,593 | 446,472 | 422,655 | 412,799 | 405,850 | 404,667 | 403,549 | 376,851 | 367,684 | 374,911 |
| 2010's | 357,167 | 331,358 | 312,446 | 291,245 | 289,019 | 326,307 | 330,128 | 291,859 | 294,472 | 291,745 |
| 2020's | 304,411 | 261,613 | 256,203 | 261,968 |
| - = No Data Reported; -- = Not Applicable; NA = Not Available; W = Withheld to avoid disclosure of individual company data. |
| Release Date: 6/28/2024 |
| Next Release Date: 8/30/2024 |