|
Download Data (XLS File) |
|
||||||||
|
||||||||
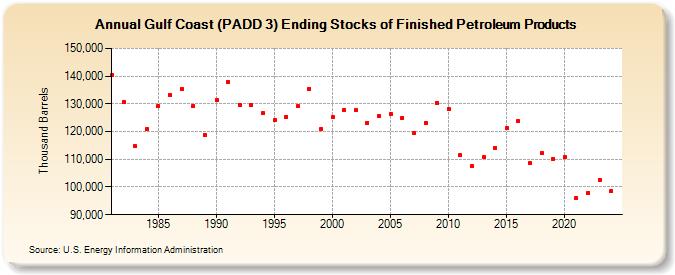
| Gulf Coast (PADD 3) Ending Stocks of Finished Petroleum Products (Thousand Barrels) | ||||||||
| Decade | Year-0 | Year-1 | Year-2 | Year-3 | Year-4 | Year-5 | Year-6 | Year-7 | Year-8 | Year-9 |
|---|---|---|---|---|---|---|---|---|---|---|
| 1980's | 140,281 | 130,670 | 114,775 | 120,825 | 129,222 | 133,309 | 135,515 | 129,202 | 118,811 | |
| 1990's | 131,221 | 137,980 | 129,580 | 129,517 | 126,599 | 123,995 | 125,260 | 129,045 | 135,527 | 120,939 |
| 2000's | 125,101 | 127,782 | 127,597 | 123,243 | 125,534 | 126,398 | 124,983 | 119,568 | 123,145 | 130,413 |
| 2010's | 128,189 | 111,370 | 107,457 | 110,692 | 114,175 | 121,308 | 123,646 | 108,651 | 112,299 | 110,234 |
| 2020's | 110,640 | 95,985 | 97,961 | 102,870 |
| - = No Data Reported; -- = Not Applicable; NA = Not Available; W = Withheld to avoid disclosure of individual company data. |
| Release Date: 3/29/2024 |
| Next Release Date: 8/30/2024 |