|
Download Data (XLS File) |
|
||||||||
|
||||||||
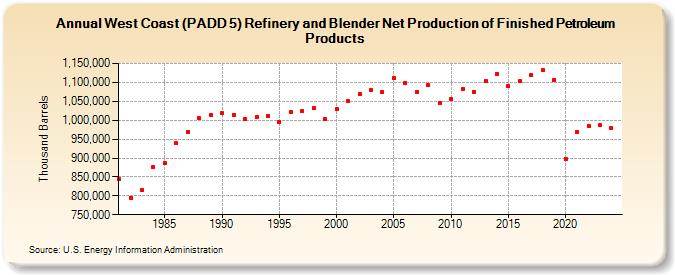
| West Coast (PADD 5) Refinery and Blender Net Production of Finished Petroleum Products (Thousand Barrels) | ||||||||
| Decade | Year-0 | Year-1 | Year-2 | Year-3 | Year-4 | Year-5 | Year-6 | Year-7 | Year-8 | Year-9 |
|---|---|---|---|---|---|---|---|---|---|---|
| 1980's | 844,455 | 795,170 | 815,901 | 875,974 | 885,860 | 939,013 | 968,155 | 1,005,449 | 1,014,317 | |
| 1990's | 1,017,721 | 1,014,444 | 1,002,114 | 1,007,532 | 1,011,996 | 994,035 | 1,021,097 | 1,024,225 | 1,031,912 | 1,003,430 |
| 2000's | 1,028,541 | 1,051,199 | 1,068,052 | 1,078,827 | 1,074,204 | 1,111,173 | 1,099,134 | 1,074,941 | 1,093,164 | 1,046,201 |
| 2010's | 1,055,839 | 1,081,568 | 1,075,328 | 1,104,141 | 1,123,402 | 1,089,207 | 1,104,242 | 1,118,902 | 1,132,624 | 1,106,975 |
| 2020's | 897,454 | 968,886 | 985,703 | 986,484 |
| - = No Data Reported; -- = Not Applicable; NA = Not Available; W = Withheld to avoid disclosure of individual company data. |
| Release Date: 3/29/2024 |
| Next Release Date: 8/30/2024 |