|
Download Data (XLS File) |
|
||||||||
|
||||||||
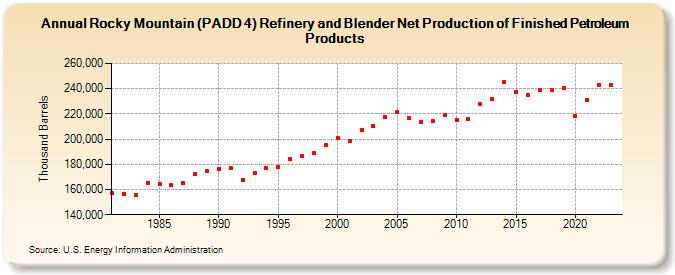
| Rocky Mountain (PADD 4) Refinery and Blender Net Production of Finished Petroleum Products (Thousand Barrels) | ||||||||
| Decade | Year-0 | Year-1 | Year-2 | Year-3 | Year-4 | Year-5 | Year-6 | Year-7 | Year-8 | Year-9 |
|---|---|---|---|---|---|---|---|---|---|---|
| 1980's | 157,261 | 156,581 | 155,692 | 165,408 | 164,474 | 163,477 | 165,120 | 172,197 | 174,312 | |
| 1990's | 176,529 | 176,885 | 167,859 | 172,876 | 176,910 | 177,735 | 184,295 | 186,965 | 188,744 | 195,282 |
| 2000's | 201,116 | 198,723 | 207,050 | 210,583 | 217,156 | 221,484 | 216,822 | 213,518 | 214,734 | 219,302 |
| 2010's | 215,153 | 216,322 | 227,527 | 231,842 | 245,258 | 237,303 | 234,646 | 238,691 | 239,048 | 240,311 |
| 2020's | 218,315 | 231,128 | 242,911 | 243,099 |
| - = No Data Reported; -- = Not Applicable; NA = Not Available; W = Withheld to avoid disclosure of individual company data. |
| Release Date: 3/29/2024 |
| Next Release Date: 8/30/2024 |