|
Download Data (XLS File) |
|
||||||||
|
||||||||
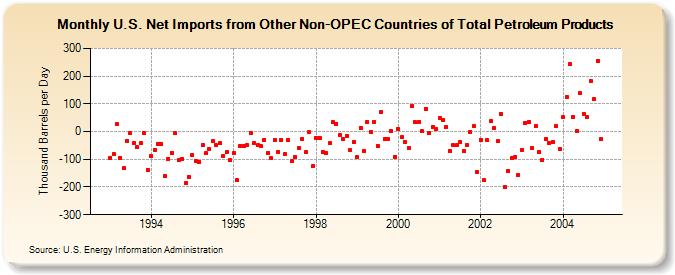
| U.S. Net Imports from Other Non-OPEC Countries of Total Petroleum Products (Thousand Barrels per Day) | ||||||||
| Year | Jan | Feb | Mar | Apr | May | Jun | Jul | Aug | Sep | Oct | Nov | Dec |
|---|---|---|---|---|---|---|---|---|---|---|---|---|
| 1993 | -94 | -81 | 26 | -95 | -133 | -34 | -6 | -42 | -55 | -43 | -6 | -137 |
| 1994 | -89 | -65 | -44 | -46 | -162 | -98 | -76 | -7 | -104 | -98 | -187 | -163 |
| 1995 | -84 | -106 | -109 | -48 | -79 | -63 | -35 | -49 | -42 | -89 | -75 | -103 |
| 1996 | -78 | -176 | -51 | -51 | -49 | -5 | -42 | -50 | -52 | -31 | -76 | -97 |
| 1997 | -29 | -73 | -30 | -82 | -32 | -108 | -92 | -59 | -26 | -75 | -3 | -126 |
| 1998 | -22 | -22 | -72 | -76 | -43 | 33 | 29 | -13 | -27 | -15 | -68 | -36 |
| 1999 | -92 | 14 | -71 | 35 | 0 | 36 | -51 | 69 | -27 | -27 | 1 | -90 |
| 2000 | 10 | -21 | -36 | -60 | 93 | 33 | 36 | 1 | 83 | -7 | 18 | 9 |
| 2001 | 49 | 42 | 17 | -70 | -50 | -50 | -37 | -70 | -48 | 0 | 19 | -146 |
| 2002 | -29 | -175 | -32 | 37 | 13 | -35 | 63 | -201 | -142 | -97 | -91 | -156 |
| 2003 | -65 | 32 | 35 | -61 | 19 | -74 | -102 | -27 | -43 | -37 | 19 | -62 |
| 2004 | 52 | 126 | 243 | 54 | 2 | 138 | 65 | 53 | 182 | 118 | 256 | -27 |
| - = No Data Reported; -- = Not Applicable; NA = Not Available; W = Withheld to avoid disclosure of individual company data. |
| Release Date: 3/29/2024 |
| Next Release Date: 4/30/2024 |