|
Download Data (XLS File) |
|
||||||||
|
||||||||
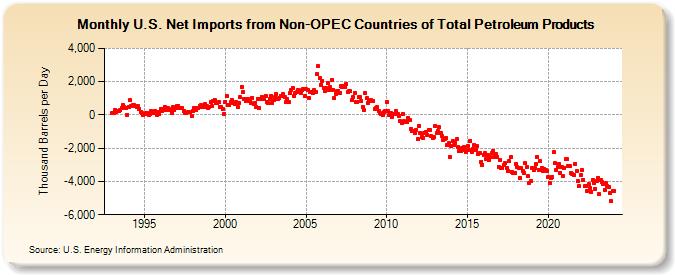
| U.S. Net Imports from Non-OPEC Countries of Total Petroleum Products (Thousand Barrels per Day) | ||||||||
| Year | Jan | Feb | Mar | Apr | May | Jun | Jul | Aug | Sep | Oct | Nov | Dec |
|---|---|---|---|---|---|---|---|---|---|---|---|---|
| 1993 | 129 | 142 | 293 | 188 | 241 | 263 | 314 | 417 | 570 | 462 | 406 | 20 |
| 1994 | 505 | 871 | 528 | 607 | 586 | 520 | 493 | 547 | 345 | 187 | 118 | -1 |
| 1995 | 56 | 89 | 122 | 16 | 71 | 221 | 115 | 205 | 219 | 22 | 174 | 29 |
| 1996 | 365 | 240 | 384 | 502 | 295 | 401 | 327 | 320 | 101 | 463 | 287 | 441 |
| 1997 | 543 | 565 | 443 | 441 | 415 | 245 | 138 | 105 | 151 | 204 | 148 | -88 |
| 1998 | 253 | 396 | 290 | 390 | 446 | 533 | 591 | 468 | 494 | 649 | 537 | 428 |
| 1999 | 499 | 788 | 519 | 814 | 903 | 709 | 726 | 773 | 492 | 482 | 365 | 73 |
| 2000 | 795 | 1,126 | 591 | 603 | 769 | 907 | 727 | 647 | 788 | 466 | 690 | 1,053 |
| 2001 | 1,698 | 1,384 | 951 | 865 | 947 | 930 | 833 | 721 | 1,043 | 629 | 739 | 470 |
| 2002 | 987 | 422 | 972 | 1,103 | 978 | 972 | 1,151 | 769 | 703 | 961 | 1,141 | 715 |
| 2003 | 869 | 1,064 | 1,243 | 975 | 997 | 1,148 | 1,119 | 1,229 | 1,062 | 777 | 957 | 798 |
| 2004 | 1,295 | 1,527 | 1,622 | 1,150 | 1,298 | 1,353 | 1,511 | 1,460 | 1,310 | 1,469 | 1,566 | 1,121 |
| 2005 | 1,532 | 1,528 | 1,046 | 1,354 | 1,404 | 1,332 | 1,470 | 1,397 | 2,452 | 2,925 | 2,196 | 1,802 |
| 2006 | 2,050 | 1,626 | 1,421 | 1,616 | 1,904 | 1,500 | 1,684 | 2,127 | 1,525 | 1,021 | 1,263 | 1,452 |
| 2007 | 1,455 | 1,330 | 1,721 | 1,697 | 1,761 | 1,699 | 1,873 | 1,372 | 1,419 | 1,417 | 873 | 1,048 |
| 2008 | 1,343 | 751 | 777 | 1,072 | 1,050 | 834 | 492 | 290 | 1,293 | 1,002 | 735 | 855 |
| 2009 | 870 | 822 | 835 | 358 | 441 | 450 | 216 | 128 | 85 | -32 | 149 | 229 |
| 2010 | 771 | 208 | -16 | 111 | -103 | 49 | 78 | 214 | 37 | -70 | -392 | -467 |
| 2011 | 79 | -391 | -434 | -436 | -162 | -323 | -828 | -946 | -973 | -1,098 | -900 | -1,460 |
| 2012 | -644 | -1,095 | -1,309 | -1,359 | -1,101 | -1,001 | -1,187 | -892 | -929 | -1,281 | -1,387 | -1,351 |
| 2013 | -645 | -1,083 | -973 | -750 | -1,069 | -1,263 | -1,521 | -1,451 | -1,361 | -1,823 | -1,681 | -2,525 |
| 2014 | -1,895 | -1,559 | -1,833 | -1,671 | -1,469 | -1,924 | -2,150 | -2,192 | -2,003 | -1,936 | -2,125 | -2,230 |
| 2015 | -1,847 | -2,085 | -1,552 | -2,243 | -2,047 | -1,804 | -2,111 | -1,898 | -2,325 | -2,318 | -2,801 | -2,992 |
| 2016 | -2,403 | -2,315 | -2,649 | -2,437 | -2,715 | -2,541 | -2,307 | -2,168 | -2,551 | -2,353 | -2,517 | -3,113 |
| 2017 | -2,699 | -3,170 | -3,182 | -3,022 | -2,915 | -3,207 | -3,343 | -2,777 | -2,548 | -3,402 | -3,474 | -3,484 |
| 2018 | -2,929 | -3,152 | -3,167 | -3,769 | -3,212 | -3,347 | -3,469 | -2,908 | -3,140 | -3,692 | -4,082 | -3,985 |
| 2019 | -3,178 | -3,334 | -3,164 | -2,941 | -2,544 | -3,320 | -2,795 | -3,178 | -3,347 | -3,227 | -3,315 | -3,379 |
| 2020 | -3,708 | -4,113 | -3,817 | -3,711 | -2,259 | -2,907 | -3,302 | -3,111 | -2,929 | -3,463 | -3,120 | -3,664 |
| 2021 | -3,165 | -2,679 | -2,666 | -3,091 | -3,084 | -3,463 | -3,531 | -3,614 | -2,933 | -3,374 | -3,989 | -4,301 |
| 2022 | -3,609 | -3,316 | -3,901 | -4,301 | -4,249 | -4,548 | -4,180 | -4,400 | -4,619 | -3,917 | -4,075 | -4,426 |
| 2023 | -3,929 | -3,689 | -4,772 | -3,937 | -4,253 | -4,141 | -4,718 | -4,310 | -4,328 | -4,432 | -4,717 | -5,118 |
| 2024 | -4,602 | -4,564 | -4,681 | -4,532 | -4,400 | -4,975 | ||||||
| - = No Data Reported; -- = Not Applicable; NA = Not Available; W = Withheld to avoid disclosure of individual company data. |
| Release Date: 8/30/2024 |
| Next Release Date: 9/30/2024 |