|
Download Data (XLS File) |
|
||||||||
|
||||||||
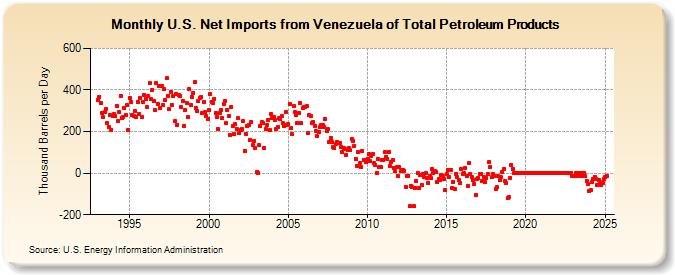
| U.S. Net Imports from Venezuela of Total Petroleum Products (Thousand Barrels per Day) | ||||||||
| Year | Jan | Feb | Mar | Apr | May | Jun | Jul | Aug | Sep | Oct | Nov | Dec |
|---|---|---|---|---|---|---|---|---|---|---|---|---|
| 1993 | 352 | 367 | 335 | 287 | 268 | 292 | 309 | 240 | 222 | 279 | 208 | 273 |
| 1994 | 283 | 275 | 325 | 249 | 294 | 371 | 264 | 269 | 311 | 280 | 326 | 209 |
| 1995 | 362 | 341 | 282 | 275 | 298 | 270 | 343 | 285 | 359 | 272 | 344 | 378 |
| 1996 | 358 | 319 | 370 | 433 | 356 | 398 | 348 | 303 | 433 | 333 | 421 | 311 |
| 1997 | 418 | 329 | 406 | 351 | 456 | 372 | 307 | 392 | 328 | 369 | 249 | 381 |
| 1998 | 233 | 377 | 371 | 316 | 347 | 227 | 303 | 339 | 271 | 403 | 329 | 368 |
| 1999 | 387 | 437 | 315 | 298 | 345 | 360 | 364 | 291 | 341 | 295 | 274 | 261 |
| 2000 | 302 | 380 | 341 | 336 | 358 | 289 | 270 | 210 | 290 | 305 | 266 | 333 |
| 2001 | 346 | 239 | 304 | 276 | 183 | 317 | 229 | 186 | 235 | 214 | 263 | 192 |
| 2002 | 208 | 213 | 249 | 108 | 188 | 226 | 232 | 161 | 244 | 135 | 154 | 119 |
| 2003 | 4 | -1 | 135 | 227 | 244 | 239 | 121 | 214 | 232 | 257 | 206 | 283 |
| 2004 | 264 | 268 | 255 | 214 | 223 | 266 | 261 | 274 | 239 | 226 | 295 | 233 |
| 2005 | 237 | 334 | 217 | 186 | 322 | 295 | 278 | 242 | 291 | 336 | 241 | 314 |
| 2006 | 316 | 319 | 322 | 191 | 278 | 273 | 242 | 247 | 228 | 204 | 178 | 198 |
| 2007 | 222 | 230 | 232 | 220 | 260 | 204 | 210 | 148 | 170 | 152 | 124 | 121 |
| 2008 | 140 | 152 | 144 | 144 | 128 | 103 | 119 | 116 | 89 | 109 | 119 | 109 |
| 2009 | 166 | 156 | 131 | 70 | 36 | 104 | 48 | 29 | 107 | 65 | 63 | 52 |
| 2010 | 68 | 92 | 57 | 84 | 90 | 47 | 40 | 1 | 68 | 28 | 30 | 64 |
| 2011 | 64 | 100 | 79 | 68 | 103 | 35 | 53 | 63 | 27 | 9 | 28 | -13 |
| 2012 | 31 | 10 | 14 | 15 | 11 | -65 | -12 | -12 | -160 | -60 | -67 | -160 |
| 2013 | -70 | -38 | 0 | -73 | -8 | -58 | -2 | -21 | -1 | -25 | -48 | -15 |
| 2014 | -24 | 19 | 2 | 8 | 4 | -45 | -30 | -32 | -7 | -14 | -30 | -83 |
| 2015 | -2 | 13 | -17 | 15 | -71 | -42 | -78 | -3 | -20 | -32 | -48 | 21 |
| 2016 | -4 | 1 | 23 | -14 | -61 | 50 | -6 | -18 | -32 | -53 | -103 | -29 |
| 2017 | -23 | -4 | -2 | -38 | -20 | -43 | -24 | -3 | 53 | 30 | -20 | -6 |
| 2018 | -14 | -74 | -69 | -16 | -33 | -21 | 4 | 21 | -38 | -46 | -121 | -116 |
| 2019 | -22 | 38 | 22 | -1 | -1 | 0 | 0 | 0 | 0 | 0 | 0 | 0 |
| 2020 | 0 | 0 | -1 | 0 | 0 | 0 | 0 | 0 | 0 | 0 | 0 | 0 |
| 2021 | 0 | 0 | 0 | -1 | 0 | 0 | 0 | -1 | 0 | 0 | 0 | 0 |
| 2022 | 0 | 0 | 0 | 0 | 0 | 0 | 0 | 0 | 0 | -1 | 0 | -15 |
| 2023 | -15 | -16 | 0 | -15 | 0 | -15 | 0 | -15 | 0 | -15 | -36 | -52 |
| 2024 | -85 | |||||||||||
| - = No Data Reported; -- = Not Applicable; NA = Not Available; W = Withheld to avoid disclosure of individual company data. |
| Release Date: 3/29/2024 |
| Next Release Date: 4/30/2024 |