|
Download Data (XLS File) |
|
||||||||
|
||||||||
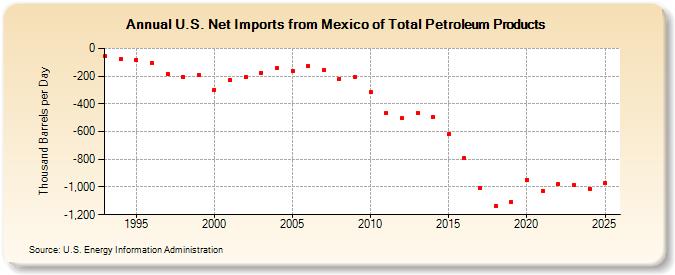
| U.S. Net Imports from Mexico of Total Petroleum Products (Thousand Barrels per Day) | ||||||||
| Decade | Year-0 | Year-1 | Year-2 | Year-3 | Year-4 | Year-5 | Year-6 | Year-7 | Year-8 | Year-9 |
|---|---|---|---|---|---|---|---|---|---|---|
| 1990's | -54 | -79 | -84 | -105 | -182 | -205 | -191 | |||
| 2000's | -297 | -228 | -207 | -174 | -143 | -162 | -126 | -155 | -218 | -204 |
| 2010's | -316 | -465 | -505 | -463 | -497 | -620 | -793 | -1,006 | -1,137 | -1,107 |
| 2020's | -947 | -1,028 | -980 | -988 |
| - = No Data Reported; -- = Not Applicable; NA = Not Available; W = Withheld to avoid disclosure of individual company data. |
| Release Date: 6/28/2024 |
| Next Release Date: 8/30/2024 |