|
Download Data (XLS File) |
|
||||||||
|
||||||||
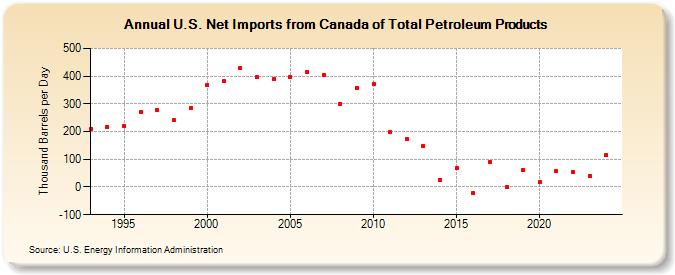
| U.S. Net Imports from Canada of Total Petroleum Products (Thousand Barrels per Day) | ||||||||
| Decade | Year-0 | Year-1 | Year-2 | Year-3 | Year-4 | Year-5 | Year-6 | Year-7 | Year-8 | Year-9 |
|---|---|---|---|---|---|---|---|---|---|---|
| 1990's | 211 | 217 | 220 | 271 | 276 | 241 | 284 | |||
| 2000's | 369 | 381 | 429 | 395 | 389 | 398 | 416 | 405 | 301 | 358 |
| 2010's | 373 | 199 | 172 | 148 | 27 | 68 | -23 | 91 | 1 | 61 |
| 2020's | 17 | 57 | 55 | 88 |
| - = No Data Reported; -- = Not Applicable; NA = Not Available; W = Withheld to avoid disclosure of individual company data. |
| Release Date: 3/29/2024 |
| Next Release Date: 8/30/2024 |