|
Download Data (XLS File) |
|
||||||||
|
||||||||
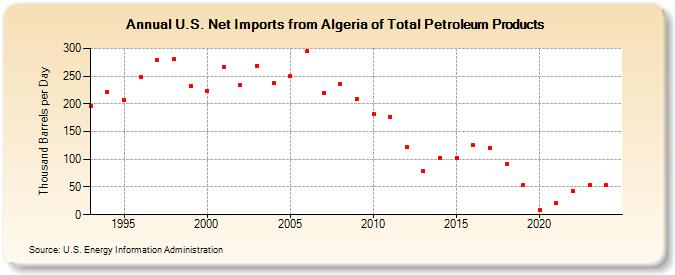
| U.S. Net Imports from Algeria of Total Petroleum Products (Thousand Barrels per Day) | ||||||||
| Decade | Year-0 | Year-1 | Year-2 | Year-3 | Year-4 | Year-5 | Year-6 | Year-7 | Year-8 | Year-9 |
|---|---|---|---|---|---|---|---|---|---|---|
| 1990's | 196 | 222 | 207 | 248 | 279 | 280 | 233 | |||
| 2000's | 224 | 267 | 234 | 269 | 237 | 250 | 295 | 220 | 236 | 209 |
| 2010's | 182 | 177 | 122 | 79 | 103 | 103 | 125 | 121 | 91 | 54 |
| 2020's | 8 | 22 | 43 | 53 |
| - = No Data Reported; -- = Not Applicable; NA = Not Available; W = Withheld to avoid disclosure of individual company data. |
| Release Date: 8/30/2024 |
| Next Release Date: 8/29/2025 |