|
Download Data (XLS File) |
|
||||||||
|
||||||||
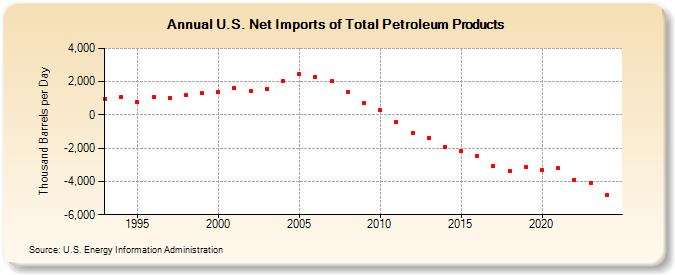
| U.S. Net Imports of Total Petroleum Products (Thousand Barrels per Day) | ||||||||
| Decade | Year-0 | Year-1 | Year-2 | Year-3 | Year-4 | Year-5 | Year-6 | Year-7 | Year-8 | Year-9 |
|---|---|---|---|---|---|---|---|---|---|---|
| 1990's | 929 | 1,090 | 751 | 1,100 | 1,040 | 1,168 | 1,300 | |||
| 2000's | 1,399 | 1,592 | 1,415 | 1,585 | 2,036 | 2,455 | 2,297 | 2,032 | 1,359 | 698 |
| 2010's | 269 | -438 | -1,066 | -1,358 | -1,928 | -2,187 | -2,465 | -3,043 | -3,379 | -3,149 |
| 2020's | -3,304 | -3,213 | -3,896 | -4,056 |
| - = No Data Reported; -- = Not Applicable; NA = Not Available; W = Withheld to avoid disclosure of individual company data. |
| Release Date: 3/29/2024 |
| Next Release Date: 8/30/2024 |