|
Download Data (XLS File) |
|
||||||||
|
||||||||
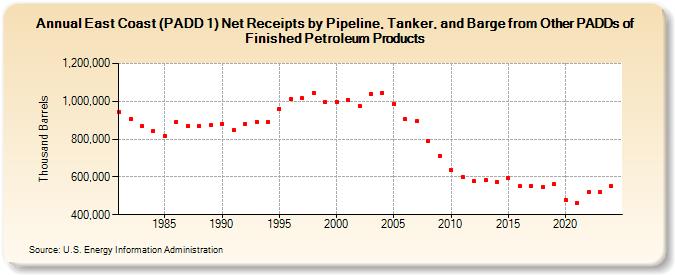
| East Coast (PADD 1) Net Receipts by Pipeline, Tanker, and Barge from Other PADDs of Finished Petroleum Products (Thousand Barrels) | ||||||||
| Decade | Year-0 | Year-1 | Year-2 | Year-3 | Year-4 | Year-5 | Year-6 | Year-7 | Year-8 | Year-9 |
|---|---|---|---|---|---|---|---|---|---|---|
| 1980's | 943,382 | 906,397 | 868,898 | 843,758 | 816,492 | 892,662 | 871,097 | 871,180 | 872,249 | |
| 1990's | 880,575 | 848,611 | 879,949 | 892,903 | 890,366 | 959,465 | 1,011,635 | 1,015,797 | 1,044,909 | 997,166 |
| 2000's | 997,948 | 1,008,186 | 975,661 | 1,038,079 | 1,045,147 | 984,945 | 904,096 | 893,574 | 792,103 | 713,110 |
| 2010's | 638,920 | 598,924 | 575,959 | 582,444 | 575,466 | 595,107 | 551,805 | 553,816 | 547,801 | 561,075 |
| 2020's | 477,433 | 462,526 | 519,255 | 519,781 |
| - = No Data Reported; -- = Not Applicable; NA = Not Available; W = Withheld to avoid disclosure of individual company data. |
| Release Date: 3/29/2024 |
| Next Release Date: 8/30/2024 |