|
Download Data (XLS File) |
|
||||||||
|
||||||||
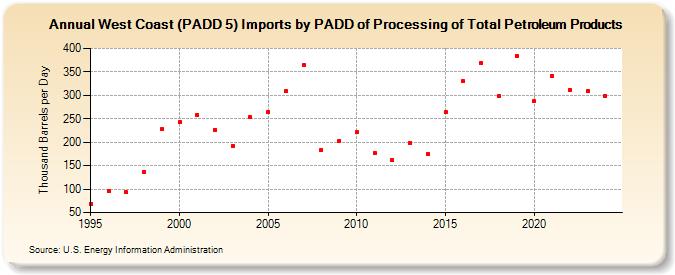
| West Coast (PADD 5) Imports by PADD of Processing of Total Petroleum Products (Thousand Barrels per Day) | ||||||||
| Decade | Year-0 | Year-1 | Year-2 | Year-3 | Year-4 | Year-5 | Year-6 | Year-7 | Year-8 | Year-9 |
|---|---|---|---|---|---|---|---|---|---|---|
| 1990's | 69 | 96 | 93 | 137 | 228 | |||||
| 2000's | 243 | 259 | 227 | 192 | 253 | 265 | 309 | 365 | 183 | 203 |
| 2010's | 221 | 178 | 161 | 199 | 175 | 264 | 330 | 369 | 298 | 384 |
| 2020's | 287 | 342 | 312 | 309 | 299 |
| - = No Data Reported; -- = Not Applicable; NA = Not Available; W = Withheld to avoid disclosure of individual company data. |
| Release Date: 6/30/2025 |
| Next Release Date: 8/29/2025 |