|
Download Data (XLS File) |
|
||||||||
|
||||||||
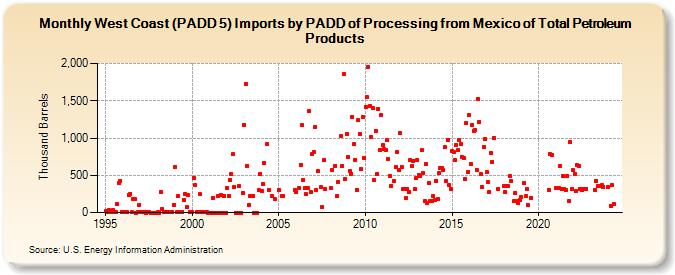
| West Coast (PADD 5) Imports by PADD of Processing from Mexico of Total Petroleum Products (Thousand Barrels) | ||||||||
| Year | Jan | Feb | Mar | Apr | May | Jun | Jul | Aug | Sep | Oct | Nov | Dec |
|---|---|---|---|---|---|---|---|---|---|---|---|---|
| 1995 | 27 | 5 | 28 | 3 | 1 | 31 | 1 | 1 | 117 | 391 | 422 | 2 |
| 1996 | 2 | 1 | 2 | 4 | 241 | 255 | 2 | 176 | 187 | 0 | 1 | 99 |
| 1997 | 1 | 2 | 2 | 1 | 0 | 2 | 2 | 0 | 0 | 0 | 0 | 0 |
| 1998 | 4 | 0 | 279 | 45 | 1 | 1 | 5 | 5 | 1 | 3 | 4 | 105 |
| 1999 | 615 | 1 | 222 | 7 | 4 | 8 | 173 | 249 | 81 | 234 | 5 | 6 |
| 2000 | 5 | 463 | 373 | 5 | 5 | 243 | 2 | 6 | 3 | 5 | 3 | 0 |
| 2001 | 0 | 0 | 200 | 0 | 0 | 0 | 222 | 0 | 230 | 0 | 221 | 0 |
| 2002 | 331 | 219 | 443 | 520 | 781 | 338 | 0 | 0 | 352 | 0 | 0 | 256 |
| 2003 | 1,181 | 1,729 | 627 | 101 | 219 | 220 | 220 | 0 | 0 | 0 | 299 | 522 |
| 2004 | 289 | 384 | 662 | 917 | 307 | 221 | 180 | |||||
| 2005 | 300 | 220 | 218 | 308 | ||||||||
| 2006 | 277 | 329 | 641 | 1,171 | 439 | 336 | 244 | 326 | 1,358 | 273 | 781 | |
| 2007 | 814 | 1,154 | 300 | 551 | 342 | 77 | 701 | 311 | ||||
| 2008 | 330 | 570 | 631 | 218 | 414 | 1,022 | 631 | 1,864 | 448 | 1,057 | ||
| 2009 | 743 | 553 | 524 | 1,283 | 919 | 710 | 303 | 1,238 | 1,059 | 587 | 1,278 | 733 |
| 2010 | 1,422 | 1,544 | 1,956 | 1,428 | 1,019 | 1,400 | 433 | 1,099 | 520 | 1,393 | 845 | 1,310 |
| 2011 | 904 | 847 | 842 | 971 | 714 | 494 | 360 | 421 | 606 | 812 | 570 | |
| 2012 | 1,070 | 615 | 316 | 316 | 201 | 322 | 273 | 699 | 629 | 693 | 316 | 463 |
| 2013 | 702 | 499 | 494 | 834 | 534 | 149 | 647 | 131 | 403 | 150 | 150 | 225 |
| 2014 | 165 | 430 | 184 | 527 | 597 | 596 | 566 | 873 | 424 | 972 | 364 | 320 |
| 2015 | 829 | 819 | 703 | 907 | 833 | 975 | 914 | 748 | 728 | 448 | 1,204 | 538 |
| 2016 | 1,313 | 648 | 1,181 | 1,098 | 1,106 | 574 | 1,527 | 1,218 | 522 | 340 | 884 | 985 |
| 2017 | 539 | 405 | 279 | 800 | 685 | 1,003 | 321 | |||||
| 2018 | 351 | 272 | 355 | 350 | 489 | 423 | 150 | 266 | 150 | 128 | 170 | |
| 2019 | 210 | 399 | 216 | 314 | 97 | 199 | ||||||
| 2020 | 302 | 781 | 775 | |||||||||
| 2021 | 324 | 328 | 625 | 320 | 488 | 316 | 303 | 488 | 157 | 945 | 318 | |
| 2022 | 567 | 522 | 288 | 637 | 624 | 320 | 302 | 319 | 316 | |||
| 2023 | 300 | 429 | 350 | 350 | 364 | 349 | ||||||
| 2024 | 341 | 93 | 365 | |||||||||
| - = No Data Reported; -- = Not Applicable; NA = Not Available; W = Withheld to avoid disclosure of individual company data. |
| Release Date: 6/28/2024 |
| Next Release Date: 7/31/2024 |