|
Download Data (XLS File) |
|
||||||||
|
||||||||
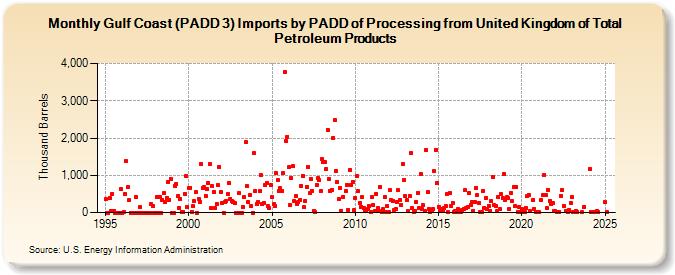
| Gulf Coast (PADD 3) Imports by PADD of Processing from United Kingdom of Total Petroleum Products (Thousand Barrels) | ||||||||
| Year | Jan | Feb | Mar | Apr | May | Jun | Jul | Aug | Sep | Oct | Nov | Dec |
|---|---|---|---|---|---|---|---|---|---|---|---|---|
| 1995 | 353 | 0 | 0 | 387 | 43 | 500 | 43 | 0 | 0 | 0 | 0 | 622 |
| 1996 | 0 | 21 | 501 | 1,379 | 682 | 329 | 0 | 0 | 0 | 0 | 413 | 0 |
| 1997 | 0 | 138 | 0 | 0 | 0 | 0 | 0 | 0 | 0 | 227 | 175 | 0 |
| 1998 | 0 | 411 | 0 | 407 | 0 | 341 | 526 | 283 | 391 | 811 | 350 | 909 |
| 1999 | 0 | 0 | 717 | 769 | 444 | 128 | 366 | 22 | 20 | 506 | 982 | 138 |
| 2000 | 663 | 671 | 15 | 169 | 308 | 544 | 0 | 371 | 293 | 1,293 | 653 | 688 |
| 2001 | 445 | 632 | 794 | 1,292 | 124 | 706 | 556 | 130 | 224 | 738 | 1,227 | 548 |
| 2002 | 252 | 0 | 279 | 310 | 487 | 804 | 377 | 297 | 282 | 248 | 0 | 0 |
| 2003 | 515 | 0 | 0 | 157 | 415 | 1,898 | 711 | 280 | 470 | 167 | 0 | 1,587 |
| 2004 | 579 | 229 | 289 | 585 | 1,001 | 222 | 254 | 741 | 790 | 169 | 111 | 752 |
| 2005 | 416 | 219 | 182 | 1,053 | 863 | 582 | 649 | 584 | 1,058 | 3,770 | 1,921 | 2,038 |
| 2006 | 1,212 | 208 | 938 | 1,236 | 312 | 440 | 231 | 294 | 341 | 721 | 992 | 141 |
| 2007 | 318 | 694 | 1,233 | 518 | 903 | 582 | 46 | 13 | 747 | 916 | 861 | 566 |
| 2008 | 1,436 | 1,347 | 1,345 | 1,171 | 2,222 | 900 | 578 | 617 | 2,010 | 2,480 | 1,121 | 828 |
| 2009 | 357 | 662 | 49 | 425 | 568 | 743 | 79 | 1,151 | 750 | 829 | 56 | |
| 2010 | 396 | 981 | 571 | 255 | 158 | 407 | 123 | 69 | 35 | 86 | 164 | 16 |
| 2011 | 410 | 208 | 31 | 508 | 119 | 44 | 693 | 14 | 86 | 416 | 21 | 175 |
| 2012 | 15 | 593 | 330 | 318 | 63 | 102 | 293 | 594 | 347 | 207 | 1,306 | 863 |
| 2013 | 435 | 335 | 29 | 440 | 1,589 | 118 | 17 | 42 | 286 | 533 | 111 | 1,041 |
| 2014 | 97 | 190 | 37 | 1,675 | 551 | 89 | 21 | 73 | 102 | 1,105 | 1,687 | 805 |
| 2015 | 157 | 51 | 103 | 47 | 123 | 184 | 485 | 5 | 519 | 189 | 255 | 13 |
| 2016 | 40 | 28 | 91 | 21 | 11 | 80 | 102 | 596 | 118 | 150 | 521 | 202 |
| 2017 | 279 | 49 | 283 | 659 | 474 | 257 | 19 | 9 | 587 | 132 | 400 | 101 |
| 2018 | 185 | 50 | 314 | 962 | 191 | 186 | 34 | 420 | 95 | 499 | 384 | 1,026 |
| 2019 | 324 | 406 | 402 | 95 | 534 | 315 | 688 | 172 | 686 | 23 | 156 | 19 |
| 2020 | 92 | 25 | 18 | 115 | 454 | 475 | 37 | 340 | 102 | 22 | 28 | |
| 2021 | 22 | 343 | 465 | 1,011 | 461 | 122 | 603 | 317 | 234 | 249 | 30 | |
| 2022 | 31 | 10 | 28 | 445 | 602 | 181 | 47 | 13 | 81 | 264 | ||
| 2023 | 408 | 5 | 8 | 47 | 12 | 12 | 156 | |||||
| - = No Data Reported; -- = Not Applicable; NA = Not Available; W = Withheld to avoid disclosure of individual company data. |
| Release Date: 3/29/2024 |
| Next Release Date: 4/30/2024 |