|
Download Data (XLS File) |
|
||||||||
|
||||||||
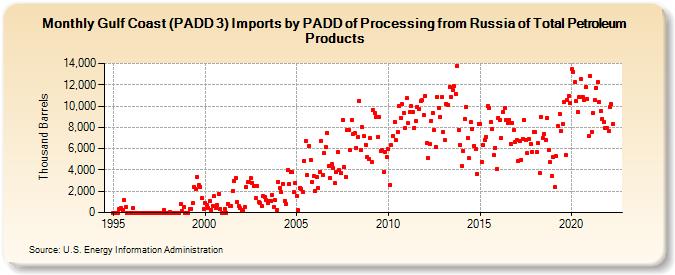
| Gulf Coast (PADD 3) Imports by PADD of Processing from Russia of Total Petroleum Products (Thousand Barrels) | ||||||||
| Year | Jan | Feb | Mar | Apr | May | Jun | Jul | Aug | Sep | Oct | Nov | Dec |
|---|---|---|---|---|---|---|---|---|---|---|---|---|
| 1995 | 0 | 0 | 0 | 0 | 367 | 440 | 254 | 1,158 | 538 | 0 | 0 | 0 |
| 1996 | 0 | 394 | 0 | 0 | 0 | 0 | 0 | 0 | 0 | 0 | 0 | 0 |
| 1997 | 0 | 0 | 0 | 0 | 0 | 0 | 0 | 0 | 0 | 232 | 0 | 0 |
| 1998 | 0 | 94 | 0 | 0 | 0 | 0 | 0 | 0 | 785 | 125 | 483 | 0 |
| 1999 | 0 | 0 | 328 | 381 | 856 | 2,427 | 2,230 | 3,317 | 2,557 | 2,434 | 1,327 | 335 |
| 2000 | 898 | 740 | 465 | 1,059 | 250 | 621 | 1,516 | 447 | 728 | 1,758 | 320 | 0 |
| 2001 | 0 | 351 | 0 | 836 | 583 | 597 | 2,039 | 3,001 | 3,247 | 985 | 603 | 425 |
| 2002 | 163 | 241 | 563 | 2,383 | 2,844 | 2,861 | 3,216 | 2,803 | 2,456 | 1,349 | 2,500 | 985 |
| 2003 | 856 | 572 | 1,569 | 1,459 | 1,140 | 907 | 1,102 | 1,064 | 1,646 | 564 | 1,139 | 271 |
| 2004 | 2,906 | 2,324 | 1,923 | 2,729 | 1,128 | 843 | 3,966 | 2,647 | 3,771 | 3,773 | 1,896 | 2,748 |
| 2005 | 1,542 | 194 | 2,310 | 2,245 | 1,889 | 4,828 | 6,714 | 3,549 | 6,206 | 4,973 | 2,882 | 3,454 |
| 2006 | 2,030 | 3,350 | 2,308 | 3,805 | 6,763 | 3,551 | 5,574 | 6,127 | 7,500 | 4,366 | 3,280 | 4,532 |
| 2007 | 4,153 | 2,736 | 3,850 | 5,695 | 3,972 | 3,682 | 8,701 | 4,270 | 3,372 | 7,727 | 7,735 | 5,846 |
| 2008 | 8,695 | 7,397 | 7,432 | 6,108 | 7,091 | 10,487 | 5,833 | 7,998 | 7,154 | 6,391 | 5,231 | 5,025 |
| 2009 | 7,010 | 4,775 | 9,656 | 9,339 | 9,006 | 7,094 | 9,003 | 5,824 | 5,889 | 3,819 | 5,658 | 5,179 |
| 2010 | 5,965 | 2,585 | 6,315 | 7,190 | 8,531 | 6,811 | 7,568 | 10,015 | 8,894 | 10,155 | 9,396 | 7,984 |
| 2011 | 10,749 | 8,379 | 9,420 | 9,999 | 9,400 | 7,970 | 8,584 | 9,950 | 9,756 | 10,458 | 10,524 | 9,185 |
| 2012 | 10,952 | 6,551 | 5,133 | 6,403 | 8,629 | 9,339 | 7,738 | 6,184 | 10,844 | 9,807 | 9,002 | 10,834 |
| 2013 | 7,552 | 6,770 | 10,232 | 10,114 | 11,769 | 10,892 | 11,533 | 11,842 | 11,164 | 13,778 | 7,774 | 6,385 |
| 2014 | 4,396 | 5,819 | 8,808 | 9,948 | 7,022 | 5,099 | 8,467 | 7,834 | 6,277 | 5,992 | 3,658 | 8,316 |
| 2015 | 8,354 | 4,759 | 6,331 | 6,820 | 7,127 | 9,966 | 9,832 | 8,509 | 7,853 | 5,387 | 6,100 | 4,114 |
| 2016 | 8,922 | 8,734 | 7,042 | 9,486 | 9,799 | 8,659 | 8,423 | 8,715 | 6,474 | 8,433 | 7,723 | 6,603 |
| 2017 | 6,828 | 4,817 | 6,704 | 4,979 | 6,890 | 8,698 | 6,798 | 5,587 | 6,906 | 6,472 | 5,724 | 7,588 |
| 2018 | 7,533 | 5,673 | 6,497 | 3,720 | 8,981 | 6,965 | 7,407 | 6,810 | 8,896 | 5,854 | 4,718 | 3,443 |
| 2019 | 5,183 | 2,360 | 5,275 | 8,084 | 9,295 | 7,702 | 8,336 | 10,363 | 5,384 | 10,599 | 10,969 | 10,262 |
| 2020 | 13,447 | 13,202 | 12,248 | 10,488 | 9,475 | 10,881 | 12,501 | 10,887 | 10,550 | 11,753 | 10,696 | 7,173 |
| 2021 | 12,810 | 7,601 | 9,367 | 10,617 | 11,734 | 12,241 | 10,385 | 9,492 | 8,798 | 8,463 | 7,957 | 7,902 |
| 2022 | 7,664 | 9,915 | 10,193 | 8,291 | ||||||||
| - = No Data Reported; -- = Not Applicable; NA = Not Available; W = Withheld to avoid disclosure of individual company data. |
| Release Date: 3/29/2024 |
| Next Release Date: 4/30/2024 |