|
Download Data (XLS File) |
|
||||||||
|
||||||||
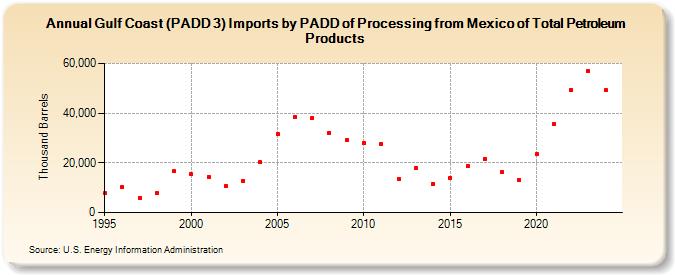
| Gulf Coast (PADD 3) Imports by PADD of Processing from Mexico of Total Petroleum Products (Thousand Barrels) | ||||||||
| Decade | Year-0 | Year-1 | Year-2 | Year-3 | Year-4 | Year-5 | Year-6 | Year-7 | Year-8 | Year-9 |
|---|---|---|---|---|---|---|---|---|---|---|
| 1990's | 7,741 | 10,234 | 6,015 | 7,748 | 16,578 | |||||
| 2000's | 15,338 | 14,465 | 10,730 | 12,814 | 20,190 | 31,584 | 38,608 | 38,227 | 32,149 | 29,193 |
| 2010's | 28,137 | 27,746 | 13,642 | 17,953 | 11,692 | 14,103 | 18,707 | 21,742 | 16,287 | 13,015 |
| 2020's | 23,552 | 35,658 | 49,494 | 56,797 |
| - = No Data Reported; -- = Not Applicable; NA = Not Available; W = Withheld to avoid disclosure of individual company data. |
| Release Date: 3/29/2024 |
| Next Release Date: 8/30/2024 |