|
Download Data (XLS File) |
|
||||||||
|
||||||||
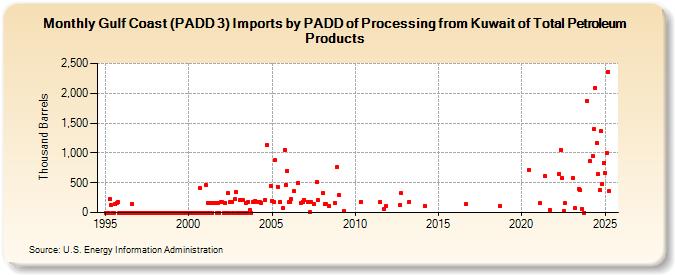
| Gulf Coast (PADD 3) Imports by PADD of Processing from Kuwait of Total Petroleum Products (Thousand Barrels) | ||||||||
| Year | Jan | Feb | Mar | Apr | May | Jun | Jul | Aug | Sep | Oct | Nov | Dec |
|---|---|---|---|---|---|---|---|---|---|---|---|---|
| 1995 | 0 | 0 | 0 | 223 | 122 | 0 | 0 | 142 | 162 | 179 | 0 | 0 |
| 1996 | 0 | 0 | 0 | 0 | 0 | 0 | 0 | 143 | 0 | 0 | 0 | 0 |
| 1997 | 0 | 0 | 0 | 0 | 0 | 0 | 0 | 0 | 0 | 0 | 0 | 0 |
| 1998 | 0 | 0 | 0 | 0 | 0 | 0 | 0 | 0 | 0 | 0 | 0 | 0 |
| 1999 | 0 | 0 | 0 | 0 | 0 | 0 | 0 | 0 | 0 | 0 | 0 | 0 |
| 2000 | 0 | 0 | 0 | 0 | 0 | 0 | 0 | 0 | 407 | 0 | 0 | 0 |
| 2001 | 464 | 0 | 167 | 0 | 167 | 0 | 160 | 167 | 0 | 167 | 0 | 180 |
| 2002 | 177 | 0 | 167 | 0 | 321 | 0 | 173 | 182 | 0 | 220 | 341 | 0 |
| 2003 | 0 | 209 | 0 | 210 | 0 | 166 | 0 | 182 | 49 | 0 | 179 | 173 |
| 2004 | 200 | 182 | 183 | 165 | 212 | 1,125 | 449 | |||||
| 2005 | 199 | 182 | 880 | 437 | 182 | 78 | 1,057 | 470 | 697 | |||
| 2006 | 171 | 184 | 224 | 357 | 496 | 165 | 182 | 210 | ||||
| 2007 | 182 | 4 | 169 | 149 | 516 | 204 | ||||||
| 2008 | 325 | 136 | 137 | 110 | 165 | 760 | ||||||
| 2009 | 296 | 18 | ||||||||||
| 2010 | 182 | |||||||||||
| 2011 | 182 | 60 | 106 | |||||||||
| 2012 | 121 | 323 | ||||||||||
| 2013 | 182 | |||||||||||
| 2014 | 116 | |||||||||||
| 2016 | 138 | |||||||||||
| 2018 | 109 | |||||||||||
| 2020 | 717 | |||||||||||
| 2021 | 157 | 608 | 49 | |||||||||
| 2022 | 654 | 1,054 | 584 | 19 | 155 | |||||||
| 2023 | 577 | 69 | 400 | 374 | 62 | 1 | 1,873 | |||||
| 2024 | 858 | 950 | 1,399 | 2,097 | ||||||||
| - = No Data Reported; -- = Not Applicable; NA = Not Available; W = Withheld to avoid disclosure of individual company data. |
| Release Date: 8/30/2024 |
| Next Release Date: 9/30/2024 |