|
Download Data (XLS File) |
|
||||||||
|
||||||||
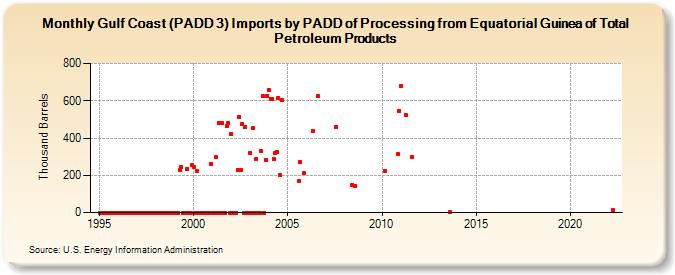
| Gulf Coast (PADD 3) Imports by PADD of Processing from Equatorial Guinea of Total Petroleum Products (Thousand Barrels) | ||||||||
| Year | Jan | Feb | Mar | Apr | May | Jun | Jul | Aug | Sep | Oct | Nov | Dec |
|---|---|---|---|---|---|---|---|---|---|---|---|---|
| 1995 | 0 | 0 | 0 | 0 | 0 | 0 | 0 | 0 | 0 | 0 | 0 | 0 |
| 1996 | 0 | 0 | 0 | 0 | 0 | 0 | 0 | 0 | 0 | 0 | 0 | 0 |
| 1997 | 0 | 0 | 0 | 0 | 0 | 0 | 0 | 0 | 0 | 0 | 0 | 0 |
| 1998 | 0 | 0 | 0 | 0 | 0 | 0 | 0 | 0 | 0 | 0 | 0 | 0 |
| 1999 | 0 | 0 | 0 | 226 | 245 | 0 | 0 | 0 | 236 | 0 | 0 | 253 |
| 2000 | 246 | 0 | 224 | 0 | 0 | 0 | 0 | 0 | 0 | 0 | 0 | 262 |
| 2001 | 0 | 0 | 297 | 0 | 479 | 0 | 480 | 0 | 0 | 462 | 481 | 0 |
| 2002 | 424 | 0 | 0 | 0 | 228 | 515 | 228 | 473 | 0 | 459 | 0 | 0 |
| 2003 | 319 | 0 | 452 | 0 | 289 | 0 | 0 | 328 | 625 | 0 | 284 | 628 |
| 2004 | 660 | 611 | 610 | 289 | 317 | 327 | 617 | 202 | 605 | |||
| 2005 | 170 | 271 | 210 | |||||||||
| 2006 | 437 | 626 | ||||||||||
| 2007 | 459 | |||||||||||
| 2008 | 150 | 144 | ||||||||||
| 2010 | 225 | 314 | 546 | |||||||||
| 2011 | 680 | 525 | 299 | |||||||||
| 2013 | 1 | |||||||||||
| 2022 | 16 | |||||||||||
| - = No Data Reported; -- = Not Applicable; NA = Not Available; W = Withheld to avoid disclosure of individual company data. |
| Release Date: 8/30/2024 |
| Next Release Date: 9/30/2024 |