|
Download Data (XLS File) |
|
||||||||
|
||||||||
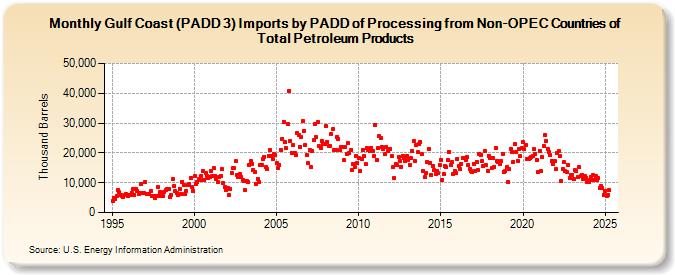
| Gulf Coast (PADD 3) Imports by PADD of Processing from Non-OPEC Countries of Total Petroleum Products (Thousand Barrels) | ||||||||
| Year | Jan | Feb | Mar | Apr | May | Jun | Jul | Aug | Sep | Oct | Nov | Dec |
|---|---|---|---|---|---|---|---|---|---|---|---|---|
| 1995 | 3,883 | 4,954 | 4,573 | 5,587 | 7,575 | 6,732 | 5,983 | 5,712 | 5,378 | 5,774 | 6,227 | 5,409 |
| 1996 | 5,970 | 6,031 | 6,589 | 7,871 | 5,918 | 7,918 | 7,305 | 6,244 | 6,715 | 9,680 | 6,632 | 6,554 |
| 1997 | 10,087 | 6,196 | 6,178 | 6,186 | 7,266 | 5,489 | 5,598 | 4,973 | 5,563 | 8,570 | 5,677 | 6,942 |
| 1998 | 5,667 | 5,420 | 6,777 | 7,449 | 7,797 | 7,740 | 5,251 | 5,931 | 11,163 | 8,837 | 7,171 | 6,680 |
| 1999 | 5,923 | 8,002 | 6,282 | 10,390 | 9,280 | 6,356 | 7,352 | 9,278 | 9,474 | 11,689 | 8,637 | 7,198 |
| 2000 | 12,099 | 9,625 | 10,244 | 11,232 | 10,944 | 12,216 | 13,957 | 11,079 | 13,424 | 12,319 | 11,538 | 11,979 |
| 2001 | 14,101 | 12,122 | 14,879 | 12,316 | 11,364 | 10,171 | 11,898 | 12,392 | 14,539 | 9,969 | 8,591 | 7,730 |
| 2002 | 8,367 | 5,904 | 7,962 | 13,319 | 14,818 | 14,859 | 17,162 | 12,696 | 12,005 | 12,799 | 12,050 | 10,991 |
| 2003 | 10,727 | 7,448 | 10,590 | 10,257 | 15,948 | 17,197 | 16,317 | 14,280 | 13,454 | 9,472 | 11,242 | 10,218 |
| 2004 | 15,886 | 15,985 | 18,008 | 18,636 | 15,190 | 14,732 | 18,902 | 20,920 | 19,096 | 18,109 | 19,714 | 19,371 |
| 2005 | 16,531 | 14,999 | 16,006 | 21,064 | 24,695 | 30,469 | 23,501 | 21,504 | 29,713 | 40,927 | 24,103 | 20,010 |
| 2006 | 22,495 | 19,971 | 19,282 | 26,699 | 25,899 | 22,060 | 25,296 | 30,631 | 27,469 | 22,648 | 19,149 | 16,618 |
| 2007 | 21,044 | 15,138 | 20,620 | 24,204 | 29,638 | 25,413 | 30,236 | 22,177 | 21,636 | 23,974 | 22,917 | 23,038 |
| 2008 | 29,065 | 23,588 | 22,297 | 22,289 | 26,426 | 28,022 | 21,054 | 21,004 | 25,462 | 24,750 | 20,949 | 21,825 |
| 2009 | 21,991 | 17,531 | 21,963 | 19,515 | 23,205 | 19,930 | 20,857 | 14,257 | 16,360 | 15,121 | 18,875 | 16,667 |
| 2010 | 18,239 | 13,877 | 18,047 | 21,103 | 18,903 | 16,262 | 21,679 | 20,830 | 20,673 | 21,817 | 20,793 | 18,909 |
| 2011 | 29,514 | 17,681 | 21,499 | 25,573 | 24,878 | 22,124 | 21,297 | 19,502 | 21,861 | 20,645 | 21,434 | 21,471 |
| 2012 | 19,058 | 15,251 | 11,546 | 16,211 | 15,817 | 18,567 | 17,430 | 15,443 | 18,974 | 18,370 | 17,318 | 19,083 |
| 2013 | 17,736 | 16,054 | 18,183 | 20,648 | 23,863 | 17,380 | 22,546 | 20,270 | 22,929 | 23,686 | 19,562 | 14,048 |
| 2014 | 11,924 | 13,311 | 16,807 | 21,315 | 16,744 | 12,550 | 15,762 | 14,237 | 12,907 | 13,994 | 13,149 | 15,996 |
| 2015 | 17,632 | 10,955 | 12,804 | 15,584 | 15,208 | 17,602 | 20,451 | 16,004 | 16,872 | 13,065 | 13,812 | 13,371 |
| 2016 | 18,094 | 15,647 | 14,556 | 16,404 | 18,233 | 18,263 | 17,649 | 18,603 | 15,809 | 14,767 | 14,004 | 13,578 |
| 2017 | 16,380 | 13,932 | 17,045 | 14,348 | 19,783 | 19,250 | 17,202 | 15,646 | 20,551 | 15,922 | 14,011 | 19,086 |
| 2018 | 18,413 | 14,779 | 18,186 | 15,377 | 21,687 | 17,452 | 16,960 | 16,413 | 17,447 | 19,577 | 13,591 | 13,853 |
| 2019 | 15,148 | 10,107 | 14,582 | 21,322 | 20,332 | 17,003 | 22,835 | 20,325 | 17,432 | 21,371 | 18,898 | 21,559 |
| 2020 | 23,657 | 21,157 | 22,672 | 17,862 | 17,933 | 18,191 | 18,693 | 19,006 | 21,170 | 19,754 | 17,758 | 13,706 |
| 2021 | 20,814 | 13,812 | 18,624 | 22,349 | 25,940 | 24,006 | 21,338 | 20,315 | 19,289 | 17,422 | 16,453 | 17,261 |
| 2022 | 14,602 | 20,111 | 20,540 | 18,828 | 10,427 | 14,571 | 16,866 | 13,817 | 13,480 | 16,089 | 11,569 | 12,460 |
| 2023 | 12,755 | 11,155 | 14,167 | 13,988 | 11,766 | 15,173 | 12,117 | 12,724 | 11,256 | 12,151 | 11,748 | 10,389 |
| 2024 | 10,257 | |||||||||||
| - = No Data Reported; -- = Not Applicable; NA = Not Available; W = Withheld to avoid disclosure of individual company data. |
| Release Date: 3/29/2024 |
| Next Release Date: 4/30/2024 |