|
Download Data (XLS File) |
|
||||||||
|
||||||||
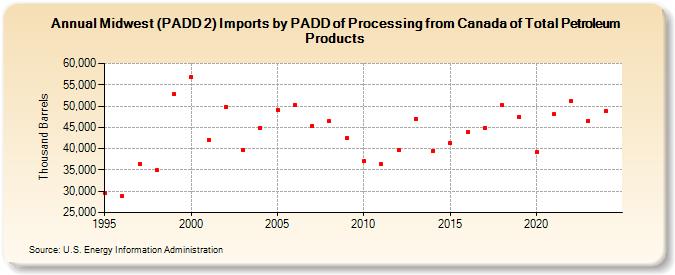
| Midwest (PADD 2) Imports by PADD of Processing from Canada of Total Petroleum Products (Thousand Barrels) | ||||||||
| Decade | Year-0 | Year-1 | Year-2 | Year-3 | Year-4 | Year-5 | Year-6 | Year-7 | Year-8 | Year-9 |
|---|---|---|---|---|---|---|---|---|---|---|
| 1990's | 29,663 | 28,828 | 36,443 | 34,932 | 52,782 | |||||
| 2000's | 56,819 | 42,035 | 49,801 | 39,630 | 44,933 | 49,180 | 50,329 | 45,385 | 46,404 | 42,491 |
| 2010's | 37,086 | 36,306 | 39,734 | 47,077 | 39,507 | 41,258 | 43,876 | 44,937 | 50,207 | 47,448 |
| 2020's | 39,113 | 48,078 | 51,154 | 46,471 |
| - = No Data Reported; -- = Not Applicable; NA = Not Available; W = Withheld to avoid disclosure of individual company data. |
| Release Date: 3/29/2024 |
| Next Release Date: 8/30/2024 |