|
Download Data (XLS File) |
|
||||||||
|
||||||||
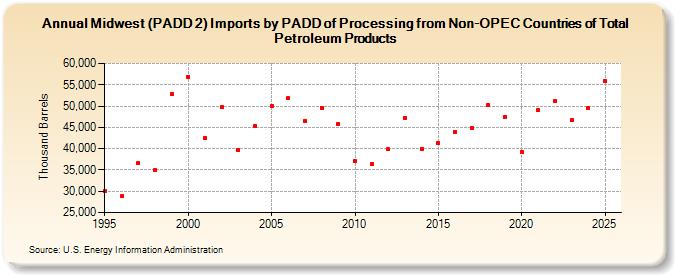
| Midwest (PADD 2) Imports by PADD of Processing from Non-OPEC Countries of Total Petroleum Products (Thousand Barrels) | ||||||||
| Decade | Year-0 | Year-1 | Year-2 | Year-3 | Year-4 | Year-5 | Year-6 | Year-7 | Year-8 | Year-9 |
|---|---|---|---|---|---|---|---|---|---|---|
| 1990's | 30,055 | 28,828 | 36,521 | 34,935 | 52,792 | |||||
| 2000's | 56,887 | 42,489 | 49,804 | 39,758 | 45,308 | 50,085 | 51,840 | 46,572 | 49,619 | 45,874 |
| 2010's | 37,140 | 36,377 | 39,837 | 47,315 | 39,928 | 41,275 | 43,891 | 44,951 | 50,241 | 47,490 |
| 2020's | 39,254 | 49,046 | 51,185 | 46,520 |
| - = No Data Reported; -- = Not Applicable; NA = Not Available; W = Withheld to avoid disclosure of individual company data. |
| Release Date: 6/28/2024 |
| Next Release Date: 8/30/2024 |