|
Download Data (XLS File) |
|
||||||||
|
||||||||
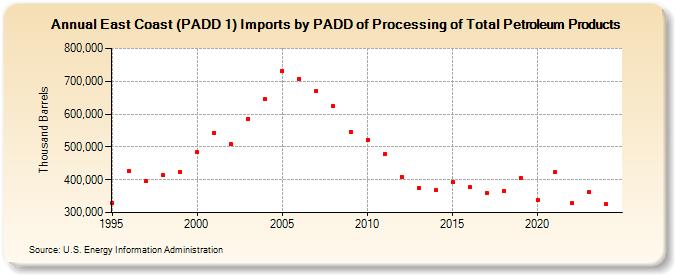
| East Coast (PADD 1) Imports by PADD of Processing of Total Petroleum Products (Thousand Barrels) | ||||||||
| Decade | Year-0 | Year-1 | Year-2 | Year-3 | Year-4 | Year-5 | Year-6 | Year-7 | Year-8 | Year-9 |
|---|---|---|---|---|---|---|---|---|---|---|
| 1990's | 328,947 | 426,510 | 395,495 | 413,386 | 424,197 | |||||
| 2000's | 484,097 | 543,478 | 507,477 | 586,431 | 644,812 | 730,437 | 708,080 | 671,030 | 624,053 | 546,231 |
| 2010's | 522,444 | 478,280 | 409,465 | 374,759 | 367,900 | 392,498 | 377,672 | 359,701 | 364,365 | 405,826 |
| 2020's | 337,859 | 422,599 | 328,779 | 362,155 |
| - = No Data Reported; -- = Not Applicable; NA = Not Available; W = Withheld to avoid disclosure of individual company data. |
| Release Date: 3/29/2024 |
| Next Release Date: 8/30/2024 |