|
Download Data (XLS File) |
|
||||||||
|
||||||||
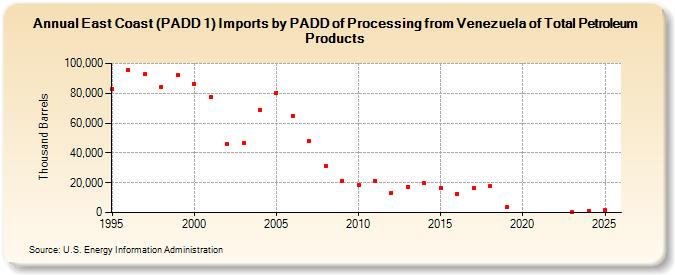
| East Coast (PADD 1) Imports by PADD of Processing from Venezuela of Total Petroleum Products (Thousand Barrels) | ||||||||
| Decade | Year-0 | Year-1 | Year-2 | Year-3 | Year-4 | Year-5 | Year-6 | Year-7 | Year-8 | Year-9 |
|---|---|---|---|---|---|---|---|---|---|---|
| 1990's | 82,819 | 95,714 | 92,610 | 84,536 | 92,305 | |||||
| 2000's | 86,406 | 77,254 | 45,981 | 46,676 | 69,028 | 80,367 | 65,025 | 47,670 | 31,542 | 21,194 |
| 2010's | 18,206 | 21,162 | 13,397 | 17,400 | 19,561 | 16,446 | 12,546 | 16,178 | 17,620 | 3,451 |
| 2020's | 84 |
| - = No Data Reported; -- = Not Applicable; NA = Not Available; W = Withheld to avoid disclosure of individual company data. |
| Release Date: 3/29/2024 |
| Next Release Date: 8/30/2024 |