|
Download Data (XLS File) |
|
||||||||
|
||||||||
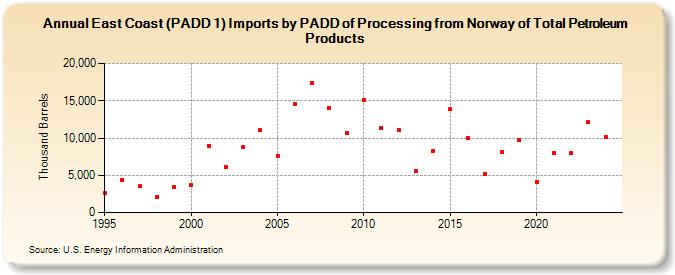
| East Coast (PADD 1) Imports by PADD of Processing from Norway of Total Petroleum Products (Thousand Barrels) | ||||||||
| Decade | Year-0 | Year-1 | Year-2 | Year-3 | Year-4 | Year-5 | Year-6 | Year-7 | Year-8 | Year-9 |
|---|---|---|---|---|---|---|---|---|---|---|
| 1990's | 2,600 | 4,414 | 3,526 | 2,100 | 3,439 | |||||
| 2000's | 3,754 | 8,976 | 6,150 | 8,729 | 11,027 | 7,560 | 14,610 | 17,418 | 13,972 | 10,657 |
| 2010's | 15,108 | 11,279 | 11,058 | 5,548 | 8,264 | 13,885 | 10,006 | 5,166 | 8,129 | 9,706 |
| 2020's | 4,166 | 7,940 | 7,976 | 12,135 |
| - = No Data Reported; -- = Not Applicable; NA = Not Available; W = Withheld to avoid disclosure of individual company data. |
| Release Date: 3/29/2024 |
| Next Release Date: 8/30/2024 |