|
Download Data (XLS File) |
|
||||||||
|
||||||||
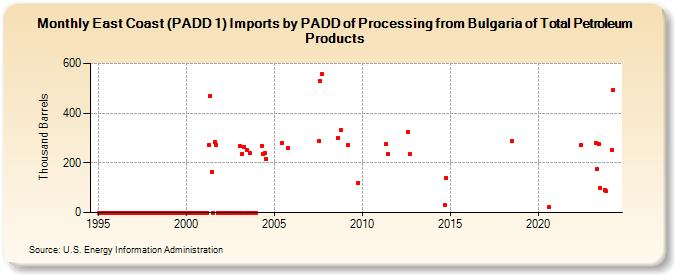
| East Coast (PADD 1) Imports by PADD of Processing from Bulgaria of Total Petroleum Products (Thousand Barrels) | ||||||||
| Year | Jan | Feb | Mar | Apr | May | Jun | Jul | Aug | Sep | Oct | Nov | Dec |
|---|---|---|---|---|---|---|---|---|---|---|---|---|
| 1995 | 0 | 0 | 0 | 0 | 0 | 0 | 0 | 0 | 0 | 0 | 0 | 0 |
| 1996 | 0 | 0 | 0 | 0 | 0 | 0 | 0 | 0 | 0 | 0 | 0 | 0 |
| 1997 | 0 | 0 | 0 | 0 | 0 | 0 | 0 | 0 | 0 | 0 | 0 | 0 |
| 1998 | 0 | 0 | 0 | 0 | 0 | 0 | 0 | 0 | 0 | 0 | 0 | 0 |
| 1999 | 0 | 0 | 0 | 0 | 0 | 0 | 0 | 0 | 0 | 0 | 0 | 0 |
| 2000 | 0 | 0 | 0 | 0 | 0 | 0 | 0 | 0 | 0 | 0 | 0 | 0 |
| 2001 | 0 | 0 | 0 | 271 | 471 | 163 | 0 | 284 | 273 | 0 | 0 | 0 |
| 2002 | 0 | 0 | 0 | 0 | 0 | 0 | 0 | 0 | 0 | 0 | 0 | 0 |
| 2003 | 266 | 0 | 237 | 264 | 0 | 253 | 0 | 238 | 0 | 0 | 0 | 0 |
| 2004 | 269 | 237 | 239 | 215 | ||||||||
| 2005 | 281 | 260 | ||||||||||
| 2007 | 288 | 529 | 558 | |||||||||
| 2008 | 301 | 334 | ||||||||||
| 2009 | 271 | 120 | ||||||||||
| 2011 | 276 | 236 | ||||||||||
| 2012 | 325 | 236 | ||||||||||
| 2014 | 29 | 139 | ||||||||||
| 2018 | 289 | |||||||||||
| 2020 | 21 | |||||||||||
| 2022 | 273 | |||||||||||
| 2023 | 281 | 174 | 275 | 100 | 91 | 85 | ||||||
| 2024 | 253 | 494 | ||||||||||
| - = No Data Reported; -- = Not Applicable; NA = Not Available; W = Withheld to avoid disclosure of individual company data. |
| Release Date: 8/30/2024 |
| Next Release Date: 9/30/2024 |