|
Download Data (XLS File) |
|
||||||||
|
||||||||
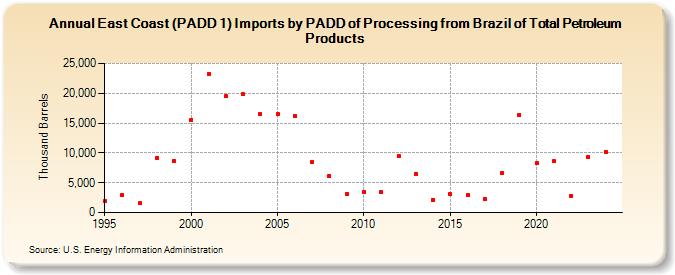
| East Coast (PADD 1) Imports by PADD of Processing from Brazil of Total Petroleum Products (Thousand Barrels) | ||||||||
| Decade | Year-0 | Year-1 | Year-2 | Year-3 | Year-4 | Year-5 | Year-6 | Year-7 | Year-8 | Year-9 |
|---|---|---|---|---|---|---|---|---|---|---|
| 1990's | 1,912 | 2,981 | 1,522 | 9,174 | 8,679 | |||||
| 2000's | 15,573 | 23,309 | 19,496 | 19,829 | 16,451 | 16,479 | 16,119 | 8,560 | 6,159 | 3,147 |
| 2010's | 3,456 | 3,402 | 9,505 | 6,505 | 2,174 | 3,045 | 2,968 | 2,301 | 6,615 | 16,380 |
| 2020's | 8,240 | 8,626 | 2,841 | 9,343 |
| - = No Data Reported; -- = Not Applicable; NA = Not Available; W = Withheld to avoid disclosure of individual company data. |
| Release Date: 3/29/2024 |
| Next Release Date: 8/30/2024 |