|
Download Data (XLS File) |
|
||||||||
|
||||||||
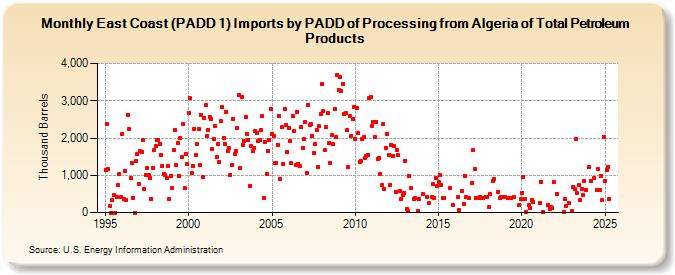
| East Coast (PADD 1) Imports by PADD of Processing from Algeria of Total Petroleum Products (Thousand Barrels) | ||||||||
| Year | Jan | Feb | Mar | Apr | May | Jun | Jul | Aug | Sep | Oct | Nov | Dec |
|---|---|---|---|---|---|---|---|---|---|---|---|---|
| 1995 | 1,155 | 2,364 | 1,157 | 178 | 0 | 349 | 463 | 0 | 429 | 728 | 1,036 | 415 |
| 1996 | 2,102 | 364 | 1,122 | 337 | 2,621 | 2,236 | 928 | 1,340 | 386 | 0 | 1,381 | 1,560 |
| 1997 | 764 | 1,652 | 1,616 | 1,940 | 622 | 1,021 | 1,191 | 998 | 935 | 369 | 1,192 | 1,673 |
| 1998 | 1,784 | 1,954 | 1,960 | 1,849 | 1,548 | 1,261 | 1,029 | 1,018 | 939 | 1,239 | 352 | 988 |
| 1999 | 652 | 1,679 | 2,219 | 1,272 | 1,869 | 974 | 2,006 | 1,480 | 2,378 | 652 | 1,580 | 1,310 |
| 2000 | 2,680 | 3,065 | 1,051 | 1,241 | 2,246 | 1,537 | 1,827 | 2,232 | 1,276 | 2,631 | 962 | 2,529 |
| 2001 | 2,875 | 2,056 | 2,208 | 2,567 | 2,520 | 1,701 | 1,963 | 2,331 | 1,483 | 1,838 | 1,357 | 2,453 |
| 2002 | 2,827 | 2,003 | 1,850 | 2,704 | 1,643 | 1,729 | 1,014 | 1,278 | 2,519 | 1,580 | 1,649 | 2,279 |
| 2003 | 3,160 | 1,194 | 3,106 | 1,809 | 1,920 | 2,561 | 2,121 | 1,954 | 725 | 1,774 | 1,640 | 1,737 |
| 2004 | 2,189 | 2,126 | 1,917 | 1,958 | 2,218 | 2,578 | 399 | 1,902 | 1,030 | 1,664 | 1,951 | 2,791 |
| 2005 | 2,112 | 2,059 | 1,338 | 1,341 | 1,824 | 2,588 | 890 | 2,286 | 1,293 | 2,791 | 2,337 | 1,638 |
| 2006 | 2,265 | 1,918 | 1,329 | 2,589 | 2,176 | 1,263 | 2,706 | 1,305 | 1,237 | 2,292 | 1,731 | 1,973 |
| 2007 | 2,424 | 1,069 | 2,897 | 2,346 | 2,376 | 2,053 | 1,593 | 1,837 | 2,220 | 1,217 | 2,315 | 2,648 |
| 2008 | 3,456 | 2,733 | 1,669 | 2,300 | 2,668 | 1,861 | 1,339 | 2,078 | 1,836 | 2,780 | 2,034 | 3,696 |
| 2009 | 3,277 | 3,645 | 3,252 | 3,441 | 2,636 | 2,679 | 2,210 | 1,213 | 2,580 | 2,061 | 2,504 | 2,839 |
| 2010 | 1,975 | 2,796 | 2,147 | 1,359 | 1,388 | 1,975 | 2,034 | 1,474 | 1,510 | 1,539 | 3,079 | 3,102 |
| 2011 | 2,324 | 2,419 | 2,035 | 2,434 | 1,443 | 1,451 | 1,037 | 730 | 2,368 | 630 | 1,735 | 2,100 |
| 2012 | 1,541 | 745 | 1,822 | 1,524 | 1,790 | 560 | 1,673 | 1,555 | 582 | 365 | 470 | 528 |
| 2013 | 1,391 | 88 | 50 | 972 | 656 | 366 | 381 | 34 | 365 | |||
| 2014 | 485 | 415 | 251 | 417 | 754 | 385 | 923 | 719 | ||||
| 2015 | 820 | 1,004 | 751 | 389 | 404 | 655 | 211 | |||||
| 2016 | 421 | 66 | 577 | 231 | 994 | 417 | 392 | |||||
| 2017 | 785 | 1,671 | 1,175 | 400 | 390 | 387 | 415 | 382 | 424 | 413 | ||
| 2018 | 140 | 500 | 839 | 891 | 545 | 383 | 421 | 418 | ||||
| 2019 | 409 | 393 | 399 | 410 | 198 | 353 | ||||||
| 2020 | 529 | 964 | 367 | 24 | 209 | 120 | 328 | 295 | ||||
| 2021 | 266 | 824 | 15 | 211 | 104 | 145 | 126 | 812 | ||||
| 2022 | 506 | 5 | 367 | 164 | 252 | |||||||
| 2023 | 29 | 696 | 641 | 1,969 | 514 | 727 | 330 | 630 | 478 | 852 | 612 | |
| 2024 | 1,219 | 840 | ||||||||||
| - = No Data Reported; -- = Not Applicable; NA = Not Available; W = Withheld to avoid disclosure of individual company data. |
| Release Date: 6/28/2024 |
| Next Release Date: 7/31/2024 |