|
Download Data (XLS File) |
|
||||||||
|
||||||||
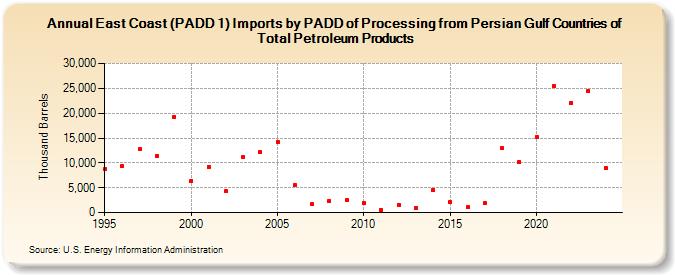
| East Coast (PADD 1) Imports by PADD of Processing from Persian Gulf Countries of Total Petroleum Products (Thousand Barrels) | ||||||||
| Decade | Year-0 | Year-1 | Year-2 | Year-3 | Year-4 | Year-5 | Year-6 | Year-7 | Year-8 | Year-9 |
|---|---|---|---|---|---|---|---|---|---|---|
| 1990's | 8,718 | 9,435 | 12,703 | 11,400 | 19,284 | |||||
| 2000's | 6,354 | 9,223 | 4,263 | 11,110 | 12,157 | 14,266 | 5,512 | 1,653 | 2,320 | 2,514 |
| 2010's | 1,888 | 477 | 1,542 | 985 | 4,584 | 2,104 | 1,038 | 1,897 | 12,921 | 10,154 |
| 2020's | 15,272 | 25,449 | 22,139 | 24,494 |
| - = No Data Reported; -- = Not Applicable; NA = Not Available; W = Withheld to avoid disclosure of individual company data. |
| Release Date: 3/29/2024 |
| Next Release Date: 8/30/2024 |