|
Download Data (XLS File) |
|
||||||||
|
||||||||
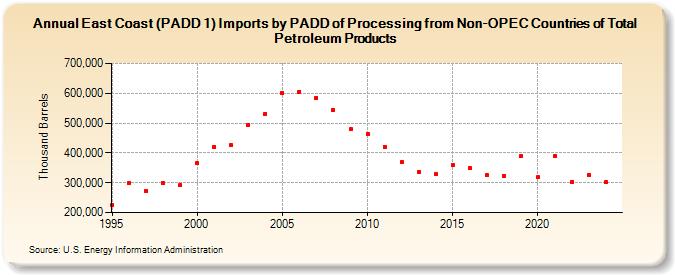
| East Coast (PADD 1) Imports by PADD of Processing from Non-OPEC Countries of Total Petroleum Products (Thousand Barrels) | ||||||||
| Decade | Year-0 | Year-1 | Year-2 | Year-3 | Year-4 | Year-5 | Year-6 | Year-7 | Year-8 | Year-9 |
|---|---|---|---|---|---|---|---|---|---|---|
| 1990's | 224,166 | 298,750 | 273,844 | 298,623 | 292,113 | |||||
| 2000's | 365,154 | 420,978 | 426,021 | 494,819 | 531,346 | 601,068 | 605,805 | 585,342 | 545,199 | 479,046 |
| 2010's | 464,637 | 421,302 | 369,396 | 337,189 | 328,202 | 359,493 | 350,143 | 324,742 | 324,235 | 388,808 |
| 2020's | 318,182 | 391,285 | 303,699 | 326,038 | 302,165 |
| - = No Data Reported; -- = Not Applicable; NA = Not Available; W = Withheld to avoid disclosure of individual company data. |
| Release Date: 6/30/2025 |
| Next Release Date: 8/29/2025 |