|
Download Data (XLS File) |
|
||||||||
|
||||||||
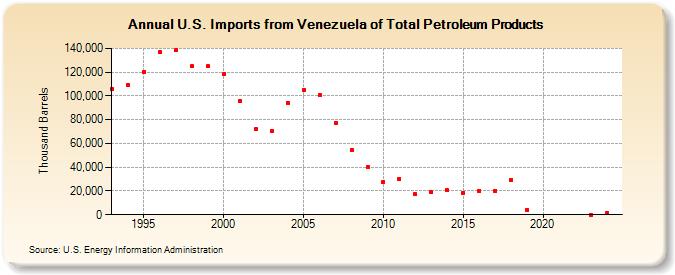
| U.S. Imports from Venezuela of Total Petroleum Products (Thousand Barrels) | ||||||||
| Decade | Year-0 | Year-1 | Year-2 | Year-3 | Year-4 | Year-5 | Year-6 | Year-7 | Year-8 | Year-9 |
|---|---|---|---|---|---|---|---|---|---|---|
| 1990's | 106,006 | 109,283 | 120,300 | 136,659 | 138,365 | 124,864 | 124,905 | |||
| 2000's | 118,129 | 95,753 | 72,092 | 70,624 | 94,413 | 105,243 | 100,946 | 77,504 | 54,610 | 40,571 |
| 2010's | 27,600 | 30,150 | 17,248 | 18,800 | 20,566 | 18,584 | 20,095 | 20,251 | 29,362 | 4,265 |
| 2020's | 84 |
| - = No Data Reported; -- = Not Applicable; NA = Not Available; W = Withheld to avoid disclosure of individual company data. |
| Release Date: 3/29/2024 |
| Next Release Date: 8/30/2024 |