|
Download Data (XLS File) |
|
||||||||
|
||||||||
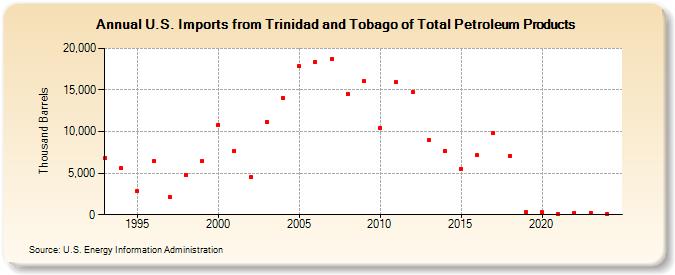
| U.S. Imports from Trinidad and Tobago of Total Petroleum Products (Thousand Barrels) | ||||||||
| Decade | Year-0 | Year-1 | Year-2 | Year-3 | Year-4 | Year-5 | Year-6 | Year-7 | Year-8 | Year-9 |
|---|---|---|---|---|---|---|---|---|---|---|
| 1990's | 6,812 | 5,579 | 2,815 | 6,407 | 2,102 | 4,794 | 6,437 | |||
| 2000's | 10,833 | 7,720 | 4,501 | 11,180 | 14,089 | 17,864 | 18,350 | 18,757 | 14,574 | 16,055 |
| 2010's | 10,466 | 15,909 | 14,724 | 8,982 | 7,632 | 5,550 | 7,124 | 9,803 | 7,101 | 350 |
| 2020's | 267 | 74 | 252 | 206 |
| - = No Data Reported; -- = Not Applicable; NA = Not Available; W = Withheld to avoid disclosure of individual company data. |
| Release Date: 3/29/2024 |
| Next Release Date: 8/30/2024 |