|
Download Data (XLS File) |
|
||||||||
|
||||||||
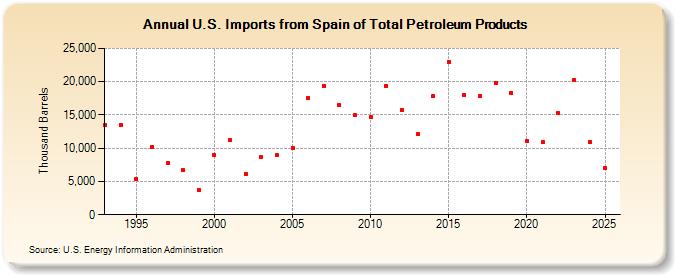
| U.S. Imports from Spain of Total Petroleum Products (Thousand Barrels) | ||||||||
| Decade | Year-0 | Year-1 | Year-2 | Year-3 | Year-4 | Year-5 | Year-6 | Year-7 | Year-8 | Year-9 |
|---|---|---|---|---|---|---|---|---|---|---|
| 1990's | 13,545 | 13,512 | 5,428 | 10,130 | 7,723 | 6,711 | 3,768 | |||
| 2000's | 8,990 | 11,159 | 6,157 | 8,679 | 8,965 | 10,067 | 17,507 | 19,401 | 16,449 | 14,928 |
| 2010's | 14,629 | 19,419 | 15,737 | 12,120 | 17,786 | 23,002 | 18,042 | 17,855 | 19,780 | 18,296 |
| 2020's | 11,031 | 10,925 | 15,315 | 20,453 |
| - = No Data Reported; -- = Not Applicable; NA = Not Available; W = Withheld to avoid disclosure of individual company data. |
| Release Date: 3/29/2024 |
| Next Release Date: 8/30/2024 |
Referring Pages: