|
Download Data (XLS File) |
|
||||||||
|
||||||||
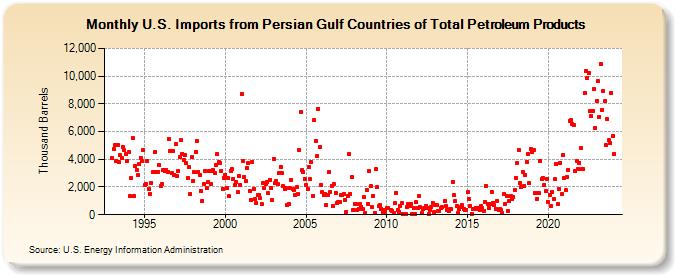
| U.S. Imports from Persian Gulf Countries of Total Petroleum Products (Thousand Barrels) | ||||||||
| Year | Jan | Feb | Mar | Apr | May | Jun | Jul | Aug | Sep | Oct | Nov | Dec |
|---|---|---|---|---|---|---|---|---|---|---|---|---|
| 1993 | 4,069 | 4,706 | 5,018 | 3,863 | 5,050 | 3,799 | 4,290 | 4,071 | 4,865 | 4,646 | 4,383 | 3,884 |
| 1994 | 4,514 | 1,319 | 2,646 | 5,558 | 1,350 | 3,531 | 3,229 | 2,845 | 3,648 | 4,112 | 3,871 | 4,648 |
| 1995 | 2,108 | 2,217 | 3,891 | 1,856 | 1,512 | 2,313 | 3,096 | 3,112 | 4,549 | 3,054 | 3,088 | 3,554 |
| 1996 | 2,080 | 2,199 | 3,215 | 3,133 | 3,238 | 3,106 | 5,469 | 4,585 | 2,993 | 4,607 | 2,870 | 5,082 |
| 1997 | 2,823 | 3,122 | 4,179 | 5,394 | 4,416 | 3,932 | 4,290 | 3,717 | 2,636 | 3,437 | 1,523 | 4,149 |
| 1998 | 2,409 | 3,064 | 4,531 | 5,348 | 3,108 | 2,875 | 1,734 | 999 | 2,243 | 3,170 | 1,905 | 2,360 |
| 1999 | 3,146 | 2,240 | 3,176 | 3,229 | 2,988 | 3,597 | 4,366 | 3,785 | 3,735 | 3,172 | 1,856 | 2,669 |
| 2000 | 2,884 | 1,901 | 2,613 | 1,318 | 3,182 | 3,306 | 2,611 | 2,113 | 2,369 | 1,624 | 2,768 | 2,168 |
| 2001 | 8,699 | 3,878 | 2,729 | 2,397 | 3,396 | 3,731 | 1,739 | 1,060 | 3,820 | 1,858 | 1,147 | 874 |
| 2002 | 1,404 | 1,401 | 1,182 | 756 | 2,282 | 1,914 | 2,180 | 2,393 | 1,560 | 2,526 | 1,940 | 1,048 |
| 2003 | 4,024 | 2,309 | 2,452 | 2,203 | 3,022 | 3,466 | 3,022 | 2,040 | 1,842 | 1,933 | 680 | 758 |
| 2004 | 1,899 | 2,508 | 1,891 | 1,802 | 1,430 | 1,993 | 1,482 | 4,648 | 7,412 | 3,241 | 3,077 | 2,554 |
| 2005 | 2,162 | 1,856 | 3,409 | 2,553 | 3,797 | 1,354 | 6,829 | 5,351 | 4,205 | 7,652 | 4,874 | 2,160 |
| 2006 | 1,647 | 1,435 | 1,516 | 683 | 1,430 | 3,057 | 1,654 | 2,092 | 597 | 2,192 | 1,589 | 848 |
| 2007 | 902 | 898 | 1,422 | 1,389 | 1,522 | 1,068 | 225 | 1,335 | 4,389 | 1,481 | 2,689 | 344 |
| 2008 | 745 | 773 | 358 | 419 | 781 | 584 | 441 | 1,244 | 132 | 1,794 | 805 | 3,154 |
| 2009 | 2,070 | 540 | 1,356 | 138 | 3,272 | 1,965 | 610 | 673 | 421 | 160 | 330 | 214 |
| 2010 | 474 | 477 | 367 | 293 | 148 | 817 | 1,592 | 350 | 188 | 638 | 824 | |
| 2011 | 74 | 37 | 522 | 770 | 603 | 766 | 18 | 449 | 60 | 890 | 508 | |
| 2012 | 1,327 | 523 | 131 | 377 | 456 | 659 | 520 | 24 | 360 | 574 | 873 | 177 |
| 2013 | 699 | 727 | 300 | 293 | 449 | 528 | 973 | 632 | 367 | 259 | 410 | |
| 2014 | 426 | 2,380 | 1,411 | 962 | 618 | 147 | 411 | 578 | 679 | 402 | 360 | 374 |
| 2015 | 1,614 | 1,148 | 635 | 78 | 394 | 390 | 507 | 396 | 460 | 315 | 637 | 473 |
| 2016 | 276 | 948 | 2,080 | 743 | 495 | 761 | 1,674 | 866 | 672 | 445 | 1,000 | 316 |
| 2017 | 436 | 305 | 138 | 1,467 | 796 | 1,379 | 303 | 976 | 1,344 | 1,154 | 1,300 | 1,807 |
| 2018 | 2,669 | 3,758 | 4,662 | 2,324 | 2,020 | 3,109 | 2,062 | 2,853 | 3,804 | 4,356 | 2,260 | 4,745 |
| 2019 | 4,549 | 4,678 | 1,574 | 1,601 | 1,156 | 1,562 | 3,911 | 2,553 | 2,649 | 2,150 | 1,684 | 2,567 |
| 2020 | 901 | 1,427 | 593 | 1,653 | 1,136 | 2,555 | 3,693 | 742 | 1,876 | 3,767 | 1,469 | 4,315 |
| 2021 | 2,617 | 1,761 | 2,731 | 3,257 | 6,764 | 6,833 | 6,539 | 6,452 | 3,170 | 3,877 | 3,281 | 3,737 |
| 2022 | 4,787 | 3,313 | 3,278 | 8,771 | 10,374 | 9,866 | 10,219 | 7,453 | 7,089 | 7,514 | 9,053 | 6,281 |
| 2023 | 8,228 | 9,612 | 7,070 | 10,880 | 7,557 | 8,940 | 8,173 | 5,028 | 6,894 | 5,356 | 5,163 | 8,811 |
| 2024 | 5,651 | 4,414 | 4,123 | 6,292 | 8,057 | 7,211 | ||||||
| - = No Data Reported; -- = Not Applicable; NA = Not Available; W = Withheld to avoid disclosure of individual company data. |
| Release Date: 8/30/2024 |
| Next Release Date: 9/30/2024 |