|
Download Data (XLS File) |
|
||||||||
|
||||||||
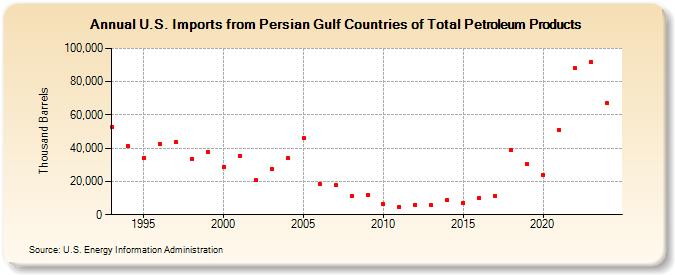
| U.S. Imports from Persian Gulf Countries of Total Petroleum Products (Thousand Barrels) | ||||||||
| Decade | Year-0 | Year-1 | Year-2 | Year-3 | Year-4 | Year-5 | Year-6 | Year-7 | Year-8 | Year-9 |
|---|---|---|---|---|---|---|---|---|---|---|
| 1990's | 52,644 | 41,271 | 34,350 | 42,577 | 43,618 | 33,746 | 37,959 | |||
| 2000's | 28,857 | 35,328 | 20,586 | 27,751 | 33,937 | 46,202 | 18,740 | 17,664 | 11,230 | 11,749 |
| 2010's | 6,168 | 4,697 | 6,001 | 5,637 | 8,748 | 7,047 | 10,276 | 11,405 | 38,622 | 30,634 |
| 2020's | 24,127 | 51,019 | 87,998 | 91,712 |
| - = No Data Reported; -- = Not Applicable; NA = Not Available; W = Withheld to avoid disclosure of individual company data. |
| Release Date: 3/29/2024 |
| Next Release Date: 8/30/2024 |