|
Download Data (XLS File) |
|
||||||||
|
||||||||
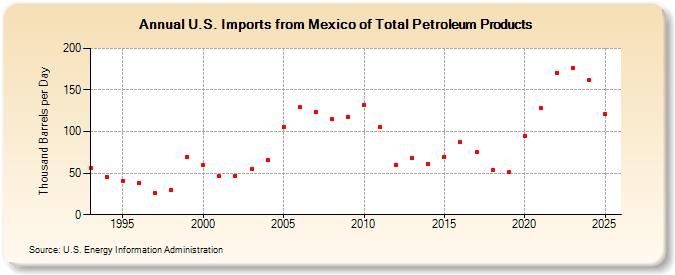
| U.S. Imports from Mexico of Total Petroleum Products (Thousand Barrels per Day) | ||||||||
| Decade | Year-0 | Year-1 | Year-2 | Year-3 | Year-4 | Year-5 | Year-6 | Year-7 | Year-8 | Year-9 |
|---|---|---|---|---|---|---|---|---|---|---|
| 1990's | 56 | 45 | 41 | 38 | 26 | 30 | 70 | |||
| 2000's | 60 | 46 | 47 | 55 | 66 | 106 | 129 | 124 | 115 | 118 |
| 2010's | 132 | 105 | 60 | 68 | 61 | 70 | 87 | 75 | 54 | 51 |
| 2020's | 95 | 128 | 171 | 177 |
| - = No Data Reported; -- = Not Applicable; NA = Not Available; W = Withheld to avoid disclosure of individual company data. |
| Release Date: 6/28/2024 |
| Next Release Date: 8/30/2024 |
Referring Pages: