|
Download Data (XLS File) |
|
||||||||
|
||||||||
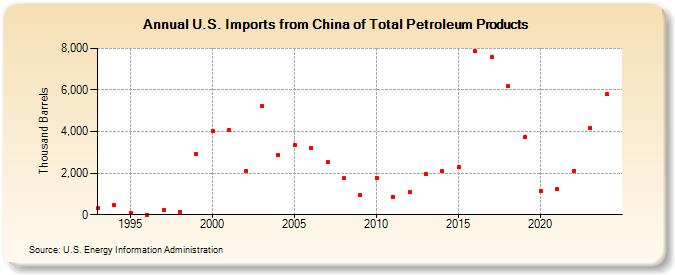
| U.S. Imports from China of Total Petroleum Products (Thousand Barrels) | ||||||||
| Decade | Year-0 | Year-1 | Year-2 | Year-3 | Year-4 | Year-5 | Year-6 | Year-7 | Year-8 | Year-9 |
|---|---|---|---|---|---|---|---|---|---|---|
| 1990's | 317 | 469 | 89 | 0 | 232 | 129 | 2,936 | |||
| 2000's | 4,004 | 4,051 | 2,091 | 5,229 | 2,865 | 3,343 | 3,218 | 2,531 | 1,743 | 968 |
| 2010's | 1,775 | 853 | 1,097 | 1,968 | 2,088 | 2,287 | 7,855 | 7,577 | 6,169 | 3,722 |
| 2020's | 1,148 | 1,229 | 2,108 | 4,174 |
| - = No Data Reported; -- = Not Applicable; NA = Not Available; W = Withheld to avoid disclosure of individual company data. |
| Release Date: 3/29/2024 |
| Next Release Date: 8/30/2024 |
Referring Pages: