|
Download Data (XLS File) |
|
||||||||
|
||||||||
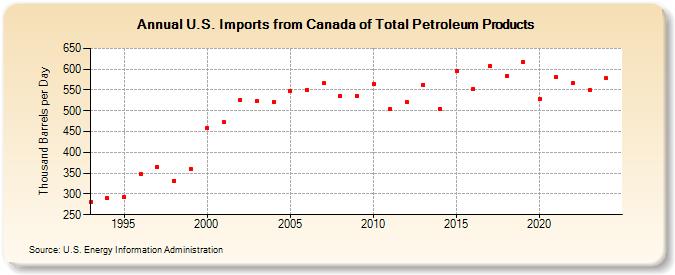
| U.S. Imports from Canada of Total Petroleum Products (Thousand Barrels per Day) | ||||||||
| Decade | Year-0 | Year-1 | Year-2 | Year-3 | Year-4 | Year-5 | Year-6 | Year-7 | Year-8 | Year-9 |
|---|---|---|---|---|---|---|---|---|---|---|
| 1990's | 281 | 289 | 292 | 348 | 365 | 332 | 361 | |||
| 2000's | 459 | 473 | 526 | 523 | 522 | 548 | 551 | 566 | 536 | 536 |
| 2010's | 565 | 504 | 521 | 563 | 505 | 596 | 553 | 608 | 584 | 618 |
| 2020's | 529 | 581 | 567 | 549 |
| - = No Data Reported; -- = Not Applicable; NA = Not Available; W = Withheld to avoid disclosure of individual company data. |
| Release Date: 3/29/2024 |
| Next Release Date: 8/30/2024 |
Referring Pages: