|
Download Data (XLS File) |
|
||||||||
|
||||||||
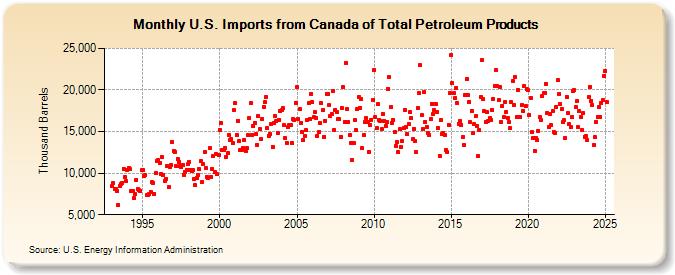
| U.S. Imports from Canada of Total Petroleum Products (Thousand Barrels) | ||||||||
| Year | Jan | Feb | Mar | Apr | May | Jun | Jul | Aug | Sep | Oct | Nov | Dec |
|---|---|---|---|---|---|---|---|---|---|---|---|---|
| 1993 | 8,473 | 8,775 | 8,145 | 8,079 | 7,865 | 6,162 | 8,473 | 8,725 | 8,858 | 10,540 | 9,586 | 8,997 |
| 1994 | 10,434 | 10,666 | 10,512 | 7,910 | 7,904 | 6,971 | 7,526 | 9,231 | 8,057 | 7,931 | 7,875 | 10,345 |
| 1995 | 10,363 | 9,708 | 9,805 | 7,323 | 7,428 | 7,531 | 7,781 | 8,919 | 8,790 | 7,527 | 10,021 | 11,516 |
| 1996 | 11,564 | 11,224 | 9,946 | 11,917 | 9,833 | 9,107 | 9,310 | 10,859 | 8,279 | 10,786 | 10,964 | 13,741 |
| 1997 | 12,684 | 12,597 | 10,823 | 11,728 | 11,392 | 10,843 | 10,709 | 11,015 | 9,813 | 10,156 | 10,392 | 11,054 |
| 1998 | 11,371 | 10,422 | 10,275 | 10,346 | 9,238 | 8,518 | 9,435 | 9,785 | 10,439 | 11,418 | 8,878 | 11,075 |
| 1999 | 12,543 | 10,566 | 9,574 | 9,472 | 12,985 | 9,556 | 10,541 | 12,107 | 10,195 | 12,346 | 9,854 | 12,180 |
| 2000 | 15,209 | 16,072 | 12,748 | 12,826 | 12,997 | 11,994 | 12,368 | 14,606 | 14,042 | 14,084 | 13,567 | 17,582 |
| 2001 | 18,394 | 14,590 | 16,329 | 13,809 | 12,784 | 12,832 | 13,005 | 13,987 | 12,716 | 12,975 | 14,543 | 16,614 |
| 2002 | 18,397 | 14,640 | 15,652 | 16,060 | 14,669 | 13,418 | 16,821 | 15,288 | 14,079 | 16,500 | 17,985 | 18,521 |
| 2003 | 19,178 | 15,405 | 14,468 | 14,750 | 15,915 | 13,162 | 15,984 | 16,917 | 16,315 | 14,850 | 16,404 | 17,473 |
| 2004 | 17,542 | 17,795 | 15,751 | 14,197 | 13,675 | 15,503 | 15,821 | 15,772 | 13,644 | 16,525 | 16,414 | 18,470 |
| 2005 | 20,383 | 16,529 | 17,690 | 16,076 | 14,956 | 13,974 | 14,503 | 15,173 | 16,334 | 18,381 | 16,480 | 19,557 |
| 2006 | 18,552 | 16,734 | 17,357 | 16,675 | 14,484 | 14,947 | 15,986 | 18,395 | 17,621 | 14,384 | 16,307 | 19,563 |
| 2007 | 19,477 | 18,157 | 16,893 | 17,118 | 19,902 | 15,134 | 17,613 | 17,322 | 16,453 | 16,460 | 14,378 | 17,860 |
| 2008 | 20,340 | 16,158 | 23,276 | 17,685 | 16,137 | 14,640 | 13,667 | 11,576 | 13,584 | 16,356 | 15,185 | 17,677 |
| 2009 | 19,159 | 17,837 | 18,900 | 12,981 | 14,535 | 16,100 | 16,582 | 16,124 | 12,599 | 15,763 | 16,419 | 18,809 |
| 2010 | 22,426 | 16,717 | 15,373 | 18,292 | 16,446 | 16,296 | 15,305 | 17,154 | 16,269 | 15,691 | 16,124 | 20,160 |
| 2011 | 21,522 | 17,951 | 16,045 | 16,448 | 14,956 | 13,272 | 13,687 | 12,505 | 15,260 | 13,190 | 13,824 | 15,384 |
| 2012 | 17,633 | 15,536 | 14,661 | 15,862 | 17,319 | 16,629 | 14,046 | 15,338 | 13,809 | 12,508 | 17,814 | 19,583 |
| 2013 | 22,948 | 16,941 | 15,283 | 19,720 | 16,148 | 15,549 | 14,826 | 14,547 | 16,488 | 18,353 | 17,110 | 17,553 |
| 2014 | 18,311 | 17,339 | 15,417 | 12,078 | 16,368 | 14,733 | 14,866 | 14,635 | 12,802 | 12,487 | 15,839 | 19,595 |
| 2015 | 24,156 | 20,846 | 19,586 | 19,058 | 20,267 | 18,399 | 15,957 | 16,297 | 15,759 | 14,372 | 13,426 | 19,449 |
| 2016 | 21,314 | 19,362 | 18,588 | 16,089 | 17,494 | 14,776 | 15,934 | 16,831 | 15,658 | 12,040 | 15,167 | 19,183 |
| 2017 | 23,557 | 18,869 | 17,419 | 16,197 | 17,299 | 16,209 | 16,593 | 16,422 | 17,603 | 18,960 | 20,471 | 22,368 |
| 2018 | 20,419 | 18,790 | 20,412 | 16,123 | 18,126 | 16,802 | 18,555 | 17,360 | 16,658 | 16,128 | 15,415 | 18,505 |
| 2019 | 21,099 | 18,213 | 21,581 | 16,711 | 20,040 | 16,804 | 16,750 | 18,179 | 17,492 | 20,495 | 18,064 | 20,084 |
| 2020 | 19,959 | 17,020 | 19,078 | 14,912 | 14,206 | 12,714 | 14,244 | 13,987 | 15,118 | 16,692 | 16,370 | 19,292 |
| 2021 | 19,587 | 19,690 | 20,751 | 17,217 | 15,571 | 17,085 | 15,728 | 17,447 | 14,959 | 14,806 | 17,960 | 21,159 |
| 2022 | 19,559 | 18,324 | 17,729 | 16,177 | 16,379 | 14,250 | 19,208 | 17,217 | 15,866 | 15,527 | 16,769 | 19,870 |
| 2023 | 19,830 | 17,912 | 18,646 | 15,364 | 17,426 | 16,712 | 15,166 | 17,224 | 14,497 | 14,509 | 13,936 | 19,132 |
| 2024 | 20,359 | 18,717 | 18,168 | 13,409 | ||||||||
| - = No Data Reported; -- = Not Applicable; NA = Not Available; W = Withheld to avoid disclosure of individual company data. |
| Release Date: 6/28/2024 |
| Next Release Date: 7/31/2024 |
Referring Pages: