|
Download Data (XLS File) |
|
||||||||
|
||||||||
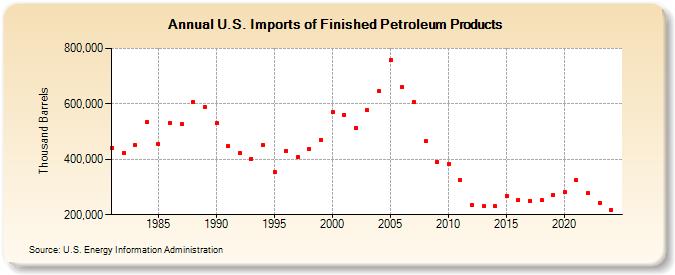
| U.S. Imports of Finished Petroleum Products (Thousand Barrels) | ||||||||
| Decade | Year-0 | Year-1 | Year-2 | Year-3 | Year-4 | Year-5 | Year-6 | Year-7 | Year-8 | Year-9 |
|---|---|---|---|---|---|---|---|---|---|---|
| 1980's | 441,527 | 423,989 | 451,048 | 532,775 | 454,947 | 532,289 | 526,804 | 606,750 | 589,630 | |
| 1990's | 529,522 | 446,272 | 423,011 | 402,314 | 451,757 | 354,104 | 430,069 | 407,780 | 437,515 | 470,569 |
| 2000's | 569,492 | 560,932 | 514,150 | 577,378 | 645,748 | 757,349 | 660,843 | 606,742 | 464,952 | 391,472 |
| 2010's | 382,740 | 326,678 | 235,989 | 230,224 | 231,086 | 268,822 | 254,713 | 250,759 | 251,790 | 272,346 |
| 2020's | 280,777 | 323,912 | 278,822 | 243,188 |
| - = No Data Reported; -- = Not Applicable; NA = Not Available; W = Withheld to avoid disclosure of individual company data. |
| Release Date: 3/29/2024 |
| Next Release Date: 8/30/2024 |