|
Download Data (XLS File) |
|
||||||||
|
||||||||
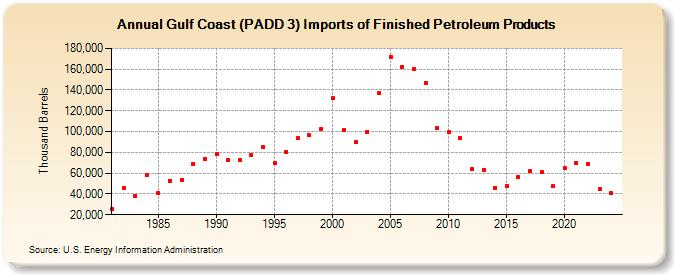
| Gulf Coast (PADD 3) Imports of Finished Petroleum Products (Thousand Barrels) | ||||||||
| Decade | Year-0 | Year-1 | Year-2 | Year-3 | Year-4 | Year-5 | Year-6 | Year-7 | Year-8 | Year-9 |
|---|---|---|---|---|---|---|---|---|---|---|
| 1980's | 25,361 | 45,473 | 38,381 | 58,673 | 41,069 | 52,804 | 53,809 | 68,378 | 73,547 | |
| 1990's | 78,758 | 73,036 | 72,546 | 77,651 | 84,972 | 69,420 | 80,661 | 93,526 | 96,225 | 102,579 |
| 2000's | 131,967 | 101,262 | 89,510 | 99,854 | 137,187 | 172,099 | 162,051 | 160,258 | 147,010 | 103,034 |
| 2010's | 99,663 | 93,725 | 64,001 | 62,846 | 45,532 | 47,821 | 56,516 | 61,650 | 60,748 | 47,204 |
| 2020's | 64,646 | 69,697 | 69,113 | 44,145 |
| - = No Data Reported; -- = Not Applicable; NA = Not Available; W = Withheld to avoid disclosure of individual company data. |
| Release Date: 6/28/2024 |
| Next Release Date: 8/30/2024 |