|
Download Data (XLS File) |
|
||||||||
|
||||||||
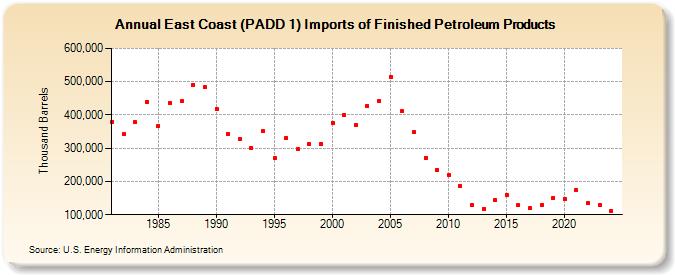
| East Coast (PADD 1) Imports of Finished Petroleum Products (Thousand Barrels) | ||||||||
| Decade | Year-0 | Year-1 | Year-2 | Year-3 | Year-4 | Year-5 | Year-6 | Year-7 | Year-8 | Year-9 |
|---|---|---|---|---|---|---|---|---|---|---|
| 1980's | 379,802 | 341,620 | 378,216 | 439,093 | 367,652 | 435,878 | 440,814 | 491,390 | 483,252 | |
| 1990's | 418,315 | 343,150 | 326,152 | 300,550 | 350,192 | 270,366 | 331,565 | 298,219 | 312,819 | 313,864 |
| 2000's | 376,039 | 401,042 | 370,033 | 427,389 | 442,191 | 514,921 | 410,860 | 348,172 | 271,704 | 235,652 |
| 2010's | 219,682 | 187,272 | 129,018 | 118,070 | 144,403 | 158,540 | 127,966 | 119,325 | 129,398 | 151,624 |
| 2020's | 147,401 | 174,029 | 134,916 | 129,696 |
| - = No Data Reported; -- = Not Applicable; NA = Not Available; W = Withheld to avoid disclosure of individual company data. |
| Release Date: 6/28/2024 |
| Next Release Date: 8/30/2024 |