|
Download Data (XLS File) |
|
||||||||
|
||||||||
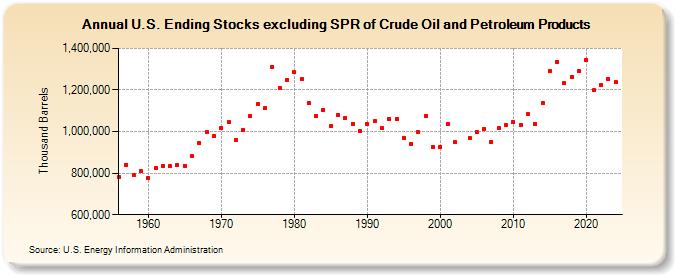
| U.S. Ending Stocks excluding SPR of Crude Oil and Petroleum Products (Thousand Barrels) | ||||||||
| Decade | Year-0 | Year-1 | Year-2 | Year-3 | Year-4 | Year-5 | Year-6 | Year-7 | Year-8 | Year-9 |
|---|---|---|---|---|---|---|---|---|---|---|
| 1950's | 780,391 | 841,317 | 788,796 | 808,042 | ||||||
| 1960's | 778,735 | 825,074 | 834,296 | 835,559 | 839,235 | 836,344 | 881,105 | 944,111 | 997,572 | 980,123 |
| 1970's | 1,017,861 | 1,043,947 | 958,979 | 1,008,307 | 1,073,646 | 1,132,955 | 1,111,810 | 1,311,893 | 1,210,759 | 1,249,671 |
| 1980's | 1,284,428 | 1,253,307 | 1,136,097 | 1,074,548 | 1,105,722 | 1,025,453 | 1,080,947 | 1,066,803 | 1,037,717 | 1,001,562 |
| 1990's | 1,034,941 | 1,048,446 | 1,017,250 | 1,060,139 | 1,061,115 | 971,212 | 941,600 | 996,330 | 1,075,570 | 925,690 |
| 2000's | 926,869 | 1,036,108 | 948,819 | 969,205 | 997,007 | 1,014,444 | 950,692 | 1,017,321 | 1,031,720 | |
| 2010's | 1,046,206 | 1,031,678 | 1,084,809 | 1,035,532 | 1,136,079 | 1,289,452 | 1,334,490 | 1,231,739 | 1,264,101 | 1,289,279 |
| 2020's | 1,346,408 | 1,198,612 | 1,222,592 | 1,252,217 |
| - = No Data Reported; -- = Not Applicable; NA = Not Available; W = Withheld to avoid disclosure of individual company data. |
| Release Date: 6/28/2024 |
| Next Release Date: 8/30/2024 |