|
Download Data (XLS File) |
|
||||||||
|
||||||||
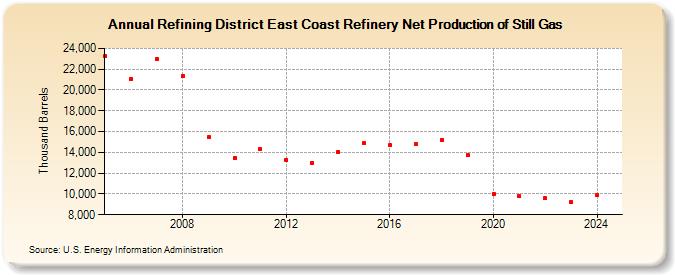
| Refining District East Coast Refinery Net Production of Still Gas (Thousand Barrels) | ||||||||
| Decade | Year-0 | Year-1 | Year-2 | Year-3 | Year-4 | Year-5 | Year-6 | Year-7 | Year-8 | Year-9 |
|---|---|---|---|---|---|---|---|---|---|---|
| 2000's | 23,273 | 21,085 | 23,000 | 21,342 | 15,467 | |||||
| 2010's | 13,449 | 14,294 | 13,259 | 13,005 | 14,035 | 14,862 | 14,675 | 14,776 | 15,220 | 13,720 |
| 2020's | 10,012 | 9,758 | 9,567 | 9,655 |
| - = No Data Reported; -- = Not Applicable; NA = Not Available; W = Withheld to avoid disclosure of individual company data. |
| Release Date: 6/28/2024 |
| Next Release Date: 8/30/2024 |
Referring Pages: