|
Download Data (XLS File) |
|
||||||||
|
||||||||
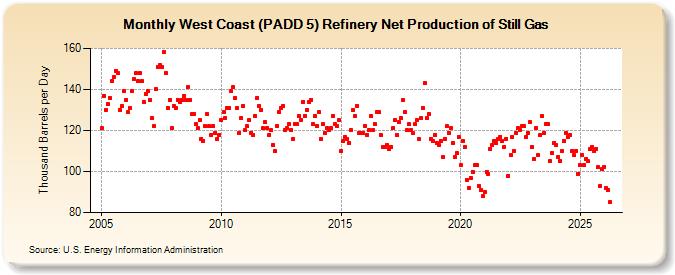
| West Coast (PADD 5) Refinery Net Production of Still Gas (Thousand Barrels per Day) | ||||||||
| Year | Jan | Feb | Mar | Apr | May | Jun | Jul | Aug | Sep | Oct | Nov | Dec |
|---|---|---|---|---|---|---|---|---|---|---|---|---|
| 2005 | 121 | 137 | 130 | 133 | 136 | 144 | 146 | 149 | 148 | 130 | 132 | 139 |
| 2006 | 135 | 129 | 131 | 139 | 145 | 148 | 144 | 148 | 144 | 134 | 138 | 139 |
| 2007 | 135 | 126 | 122 | 140 | 151 | 152 | 151 | 158 | 148 | 131 | 135 | 121 |
| 2008 | 132 | 131 | 135 | 134 | 135 | 137 | 135 | 141 | 135 | 128 | 128 | 123 |
| 2009 | 121 | 125 | 116 | 115 | 122 | 128 | 122 | 118 | 122 | 119 | 116 | 118 |
| 2010 | 125 | 129 | 126 | 131 | 131 | 139 | 141 | 136 | 131 | 119 | 126 | 132 |
| 2011 | 120 | 122 | 125 | 119 | 118 | 127 | 136 | 132 | 130 | 121 | 124 | 121 |
| 2012 | 118 | 120 | 113 | 110 | 122 | 129 | 131 | 132 | 120 | 121 | 123 | 120 |
| 2013 | 116 | 123 | 123 | 127 | 125 | 134 | 127 | 130 | 134 | 135 | 123 | 127 |
| 2014 | 122 | 129 | 116 | 123 | 119 | 121 | 120 | 121 | 127 | 123 | 122 | 125 |
| 2015 | 110 | 115 | 117 | 116 | 114 | 120 | 130 | 127 | 132 | 119 | 119 | 119 |
| 2016 | 122 | 118 | 120 | 127 | 120 | 123 | 129 | 129 | 118 | 112 | 112 | 113 |
| 2017 | 111 | 112 | 121 | 125 | 118 | 124 | 126 | 135 | 129 | 120 | 123 | 120 |
| 2018 | 119 | 123 | 125 | 116 | 126 | 131 | 143 | 126 | 128 | 116 | 115 | 118 |
| 2019 | 114 | 113 | 115 | 107 | 116 | 122 | 119 | 121 | 114 | 107 | 109 | 117 |
| 2020 | 103 | 115 | 112 | 96 | 92 | 97 | 100 | 103 | 103 | 93 | 91 | 88 |
| 2021 | 90 | 100 | 99 | 111 | 113 | 115 | 114 | 116 | 117 | 115 | 112 | 116 |
| 2022 | 98 | 108 | 117 | 110 | 119 | 121 | 120 | 122 | 122 | 117 | 119 | 124 |
| 2023 | 112 | 106 | 121 | 108 | 118 | 127 | 119 | 123 | 123 | 105 | 109 | 114 |
| 2024 | 114 | |||||||||||
| - = No Data Reported; -- = Not Applicable; NA = Not Available; W = Withheld to avoid disclosure of individual company data. |
| Release Date: 3/29/2024 |
| Next Release Date: 4/30/2024 |
Referring Pages: