|
Download Data (XLS File) |
|
||||||||
|
||||||||
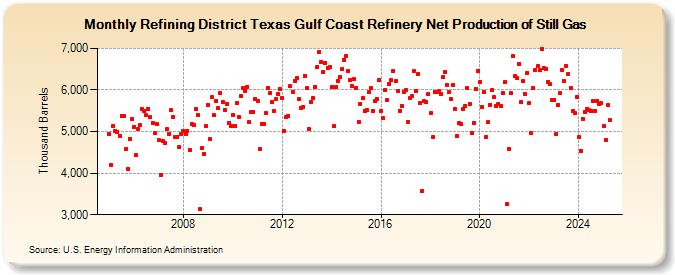
| Refining District Texas Gulf Coast Refinery Net Production of Still Gas (Thousand Barrels) | ||||||||
| Year | Jan | Feb | Mar | Apr | May | Jun | Jul | Aug | Sep | Oct | Nov | Dec |
|---|---|---|---|---|---|---|---|---|---|---|---|---|
| 2005 | 4,941 | 4,184 | 5,128 | 5,019 | 4,994 | 4,904 | 5,378 | 5,369 | 4,578 | 4,103 | 4,827 | 5,296 |
| 2006 | 5,110 | 4,426 | 5,068 | 5,155 | 5,540 | 5,499 | 5,394 | 5,552 | 5,339 | 5,209 | 4,966 | 5,180 |
| 2007 | 4,794 | 3,946 | 4,762 | 4,721 | 5,050 | 4,946 | 5,510 | 5,359 | 4,867 | 4,874 | 4,637 | 4,952 |
| 2008 | 5,012 | 4,953 | 5,023 | 4,564 | 5,173 | 5,150 | 5,539 | 5,398 | 3,127 | 4,606 | 4,459 | 5,145 |
| 2009 | 5,638 | 4,821 | 5,827 | 5,390 | 5,739 | 5,555 | 5,930 | 5,703 | 5,517 | 5,668 | 5,216 | 5,141 |
| 2010 | 5,399 | 5,124 | 5,689 | 5,343 | 5,857 | 6,053 | 5,984 | 6,080 | 5,219 | 5,467 | 5,463 | 5,780 |
| 2011 | 5,741 | 4,576 | 5,170 | 5,182 | 5,437 | 6,056 | 5,924 | 5,702 | 5,495 | 5,787 | 5,903 | 6,023 |
| 2012 | 5,807 | 5,022 | 5,351 | 5,384 | 6,094 | 5,960 | 6,220 | 6,292 | 5,779 | 5,578 | 5,588 | 6,334 |
| 2013 | 6,038 | 5,054 | 5,716 | 5,798 | 6,081 | 6,561 | 6,910 | 6,681 | 6,439 | 6,660 | 6,531 | 6,545 |
| 2014 | 6,072 | 5,135 | 6,063 | 6,217 | 6,302 | 6,501 | 6,729 | 6,806 | 6,447 | 6,244 | 6,086 | 6,254 |
| 2015 | 6,056 | 5,230 | 5,665 | 5,795 | 5,500 | 5,522 | 5,940 | 6,038 | 5,486 | 5,727 | 5,788 | 6,247 |
| 2016 | 5,497 | 5,324 | 5,992 | 5,747 | 6,155 | 6,233 | 6,456 | 6,206 | 5,982 | 5,502 | 5,625 | 5,958 |
| 2017 | 5,999 | 5,237 | 5,798 | 5,845 | 6,449 | 5,964 | 6,394 | 5,682 | 3,567 | 5,725 | 5,717 | 5,894 |
| 2018 | 5,444 | 4,860 | 5,951 | 5,946 | 5,969 | 5,902 | 6,303 | 6,427 | 6,113 | 5,943 | 5,779 | 6,124 |
| 2019 | 5,532 | 4,890 | 5,194 | 5,172 | 5,553 | 5,621 | 6,039 | 5,671 | 4,965 | 5,214 | 6,035 | 6,465 |
| 2020 | 6,192 | 5,595 | 5,960 | 4,879 | 5,226 | 5,645 | 5,999 | 5,830 | 5,605 | 5,672 | 5,625 | 5,936 |
| 2021 | 6,186 | 3,249 | 4,589 | 5,917 | 6,811 | 6,326 | 6,276 | 6,636 | 5,701 | 6,205 | 5,897 | 6,410 |
| 2022 | 5,687 | 4,962 | 6,046 | 6,471 | 6,567 | 6,473 | 6,992 | 6,540 | 6,493 | 6,203 | 6,137 | 5,768 |
| 2023 | 5,762 | 4,953 | 5,645 | 5,927 | 6,487 | 6,207 | 6,580 | 6,332 | 6,048 | 5,497 | 5,457 | 5,828 |
| 2024 | 4,859 | 4,532 | 5,298 | 5,474 | ||||||||
| - = No Data Reported; -- = Not Applicable; NA = Not Available; W = Withheld to avoid disclosure of individual company data. |
| Release Date: 6/28/2024 |
| Next Release Date: 7/31/2024 |