|
Download Data (XLS File) |
|
||||||||
|
||||||||
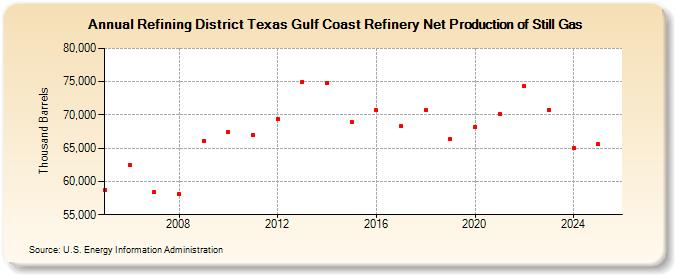
| Refining District Texas Gulf Coast Refinery Net Production of Still Gas (Thousand Barrels) | ||||||||
| Decade | Year-0 | Year-1 | Year-2 | Year-3 | Year-4 | Year-5 | Year-6 | Year-7 | Year-8 | Year-9 |
|---|---|---|---|---|---|---|---|---|---|---|
| 2000's | 58,721 | 62,438 | 58,418 | 58,149 | 66,145 | |||||
| 2010's | 67,458 | 66,996 | 69,409 | 75,014 | 74,856 | 68,994 | 70,677 | 68,271 | 70,761 | 66,351 |
| 2020's | 68,164 | 70,203 | 74,339 | 70,723 |
| - = No Data Reported; -- = Not Applicable; NA = Not Available; W = Withheld to avoid disclosure of individual company data. |
| Release Date: 3/29/2024 |
| Next Release Date: 8/30/2024 |