|
Download Data (XLS File) |
|
||||||||
|
||||||||
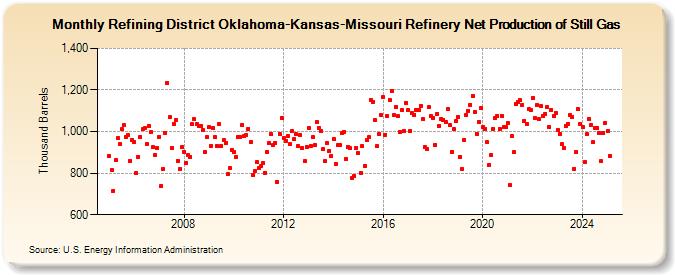
| Refining District Oklahoma-Kansas-Missouri Refinery Net Production of Still Gas (Thousand Barrels) | ||||||||
| Year | Jan | Feb | Mar | Apr | May | Jun | Jul | Aug | Sep | Oct | Nov | Dec |
|---|---|---|---|---|---|---|---|---|---|---|---|---|
| 2005 | 883 | 816 | 716 | 861 | 967 | 940 | 1,010 | 1,031 | 975 | 982 | 860 | 959 |
| 2006 | 949 | 800 | 879 | 976 | 1,011 | 1,017 | 939 | 1,029 | 1,000 | 924 | 888 | 923 |
| 2007 | 975 | 738 | 820 | 995 | 1,234 | 1,068 | 922 | 1,038 | 1,054 | 860 | 820 | 925 |
| 2008 | 903 | 849 | 886 | 879 | 1,034 | 1,059 | 1,036 | 1,028 | 1,029 | 1,008 | 904 | 972 |
| 2009 | 1,023 | 931 | 1,017 | 973 | 930 | 1,034 | 929 | 959 | 943 | 794 | 825 | 913 |
| 2010 | 904 | 878 | 974 | 975 | 1,033 | 979 | 984 | 1,014 | 948 | 792 | 808 | 852 |
| 2011 | 823 | 833 | 849 | 803 | 902 | 943 | 986 | 937 | 945 | 757 | 990 | 1,067 |
| 2012 | 969 | 955 | 978 | 938 | 1,003 | 964 | 986 | 930 | 983 | 921 | 857 | 926 |
| 2013 | 1,017 | 930 | 973 | 937 | 1,047 | 1,019 | 1,001 | 916 | 858 | 945 | 907 | 883 |
| 2014 | 962 | 845 | 935 | 935 | 991 | 1,000 | 868 | 927 | 919 | 778 | 786 | 923 |
| 2015 | 896 | 801 | 931 | 834 | 957 | 972 | 1,152 | 1,143 | 1,055 | 929 | 989 | 1,079 |
| 2016 | 1,166 | 985 | 1,074 | 1,152 | 1,197 | 1,080 | 1,120 | 1,073 | 998 | 1,103 | 1,005 | 1,138 |
| 2017 | 1,102 | 1,003 | 1,087 | 1,082 | 1,106 | 1,105 | 1,125 | 1,058 | 925 | 916 | 1,117 | 1,074 |
| 2018 | 1,066 | 937 | 1,086 | 1,028 | 1,061 | 1,057 | 1,047 | 1,109 | 1,030 | 903 | 1,011 | 1,050 |
| 2019 | 1,070 | 879 | 821 | 961 | 1,080 | 1,101 | 1,129 | 1,173 | 1,096 | 989 | 1,045 | 1,111 |
| 2020 | 1,021 | 1,013 | 948 | 840 | 888 | 1,013 | 1,067 | 1,076 | 1,014 | 1,077 | 1,022 | 1,024 |
| 2021 | 1,041 | 742 | 977 | 901 | 1,133 | 1,142 | 1,150 | 1,130 | 1,052 | 1,034 | 1,108 | 1,106 |
| 2022 | 1,163 | 1,066 | 1,130 | 1,059 | 1,122 | 1,076 | 1,086 | 1,118 | 1,023 | 1,104 | 1,073 | 1,091 |
| 2023 | 851 | 990 | 939 | 922 | 1,028 | 1,037 | 1,079 | 1,072 | 822 | 901 | 1,107 | 1,036 |
| 2024 | 1,020 | 853 | 987 | 1,060 | ||||||||
| - = No Data Reported; -- = Not Applicable; NA = Not Available; W = Withheld to avoid disclosure of individual company data. |
| Release Date: 6/28/2024 |
| Next Release Date: 7/31/2024 |