|
Download Data (XLS File) |
|
||||||||
|
||||||||
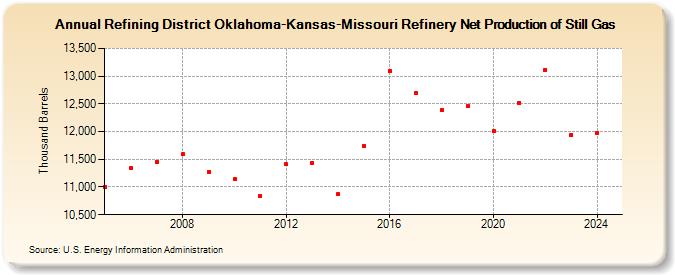
| Refining District Oklahoma-Kansas-Missouri Refinery Net Production of Still Gas (Thousand Barrels) | ||||||||
| Decade | Year-0 | Year-1 | Year-2 | Year-3 | Year-4 | Year-5 | Year-6 | Year-7 | Year-8 | Year-9 |
|---|---|---|---|---|---|---|---|---|---|---|
| 2000's | 11,000 | 11,335 | 11,449 | 11,587 | 11,271 | |||||
| 2010's | 11,141 | 10,835 | 11,410 | 11,433 | 10,869 | 11,738 | 13,091 | 12,700 | 12,385 | 12,455 |
| 2020's | 12,003 | 12,516 | 13,111 | 11,784 |
| - = No Data Reported; -- = Not Applicable; NA = Not Available; W = Withheld to avoid disclosure of individual company data. |
| Release Date: 3/29/2024 |
| Next Release Date: 8/30/2024 |