|
Download Data (XLS File) |
|
||||||||
|
||||||||
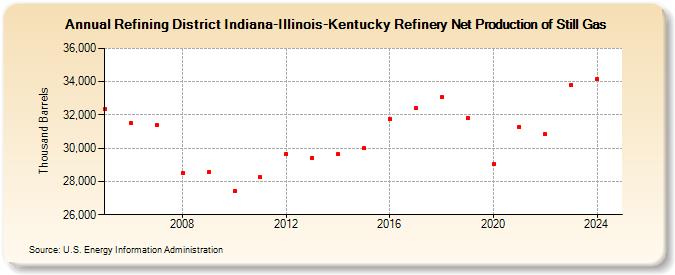
| Refining District Indiana-Illinois-Kentucky Refinery Net Production of Still Gas (Thousand Barrels) | ||||||||
| Decade | Year-0 | Year-1 | Year-2 | Year-3 | Year-4 | Year-5 | Year-6 | Year-7 | Year-8 | Year-9 |
|---|---|---|---|---|---|---|---|---|---|---|
| 2000's | 32,373 | 31,526 | 31,391 | 28,506 | 28,550 | |||||
| 2010's | 27,421 | 28,255 | 29,661 | 29,429 | 29,627 | 29,999 | 31,777 | 32,406 | 33,050 | 31,813 |
| 2020's | 29,039 | 31,286 | 30,836 | 33,784 |
| - = No Data Reported; -- = Not Applicable; NA = Not Available; W = Withheld to avoid disclosure of individual company data. |
| Release Date: 8/30/2024 |
| Next Release Date: 8/29/2025 |